College Intel

Infographics

Data infographics

Free, downloadable stat pieces -- print-ready and social-ready, sourced the same way as every article on this site.

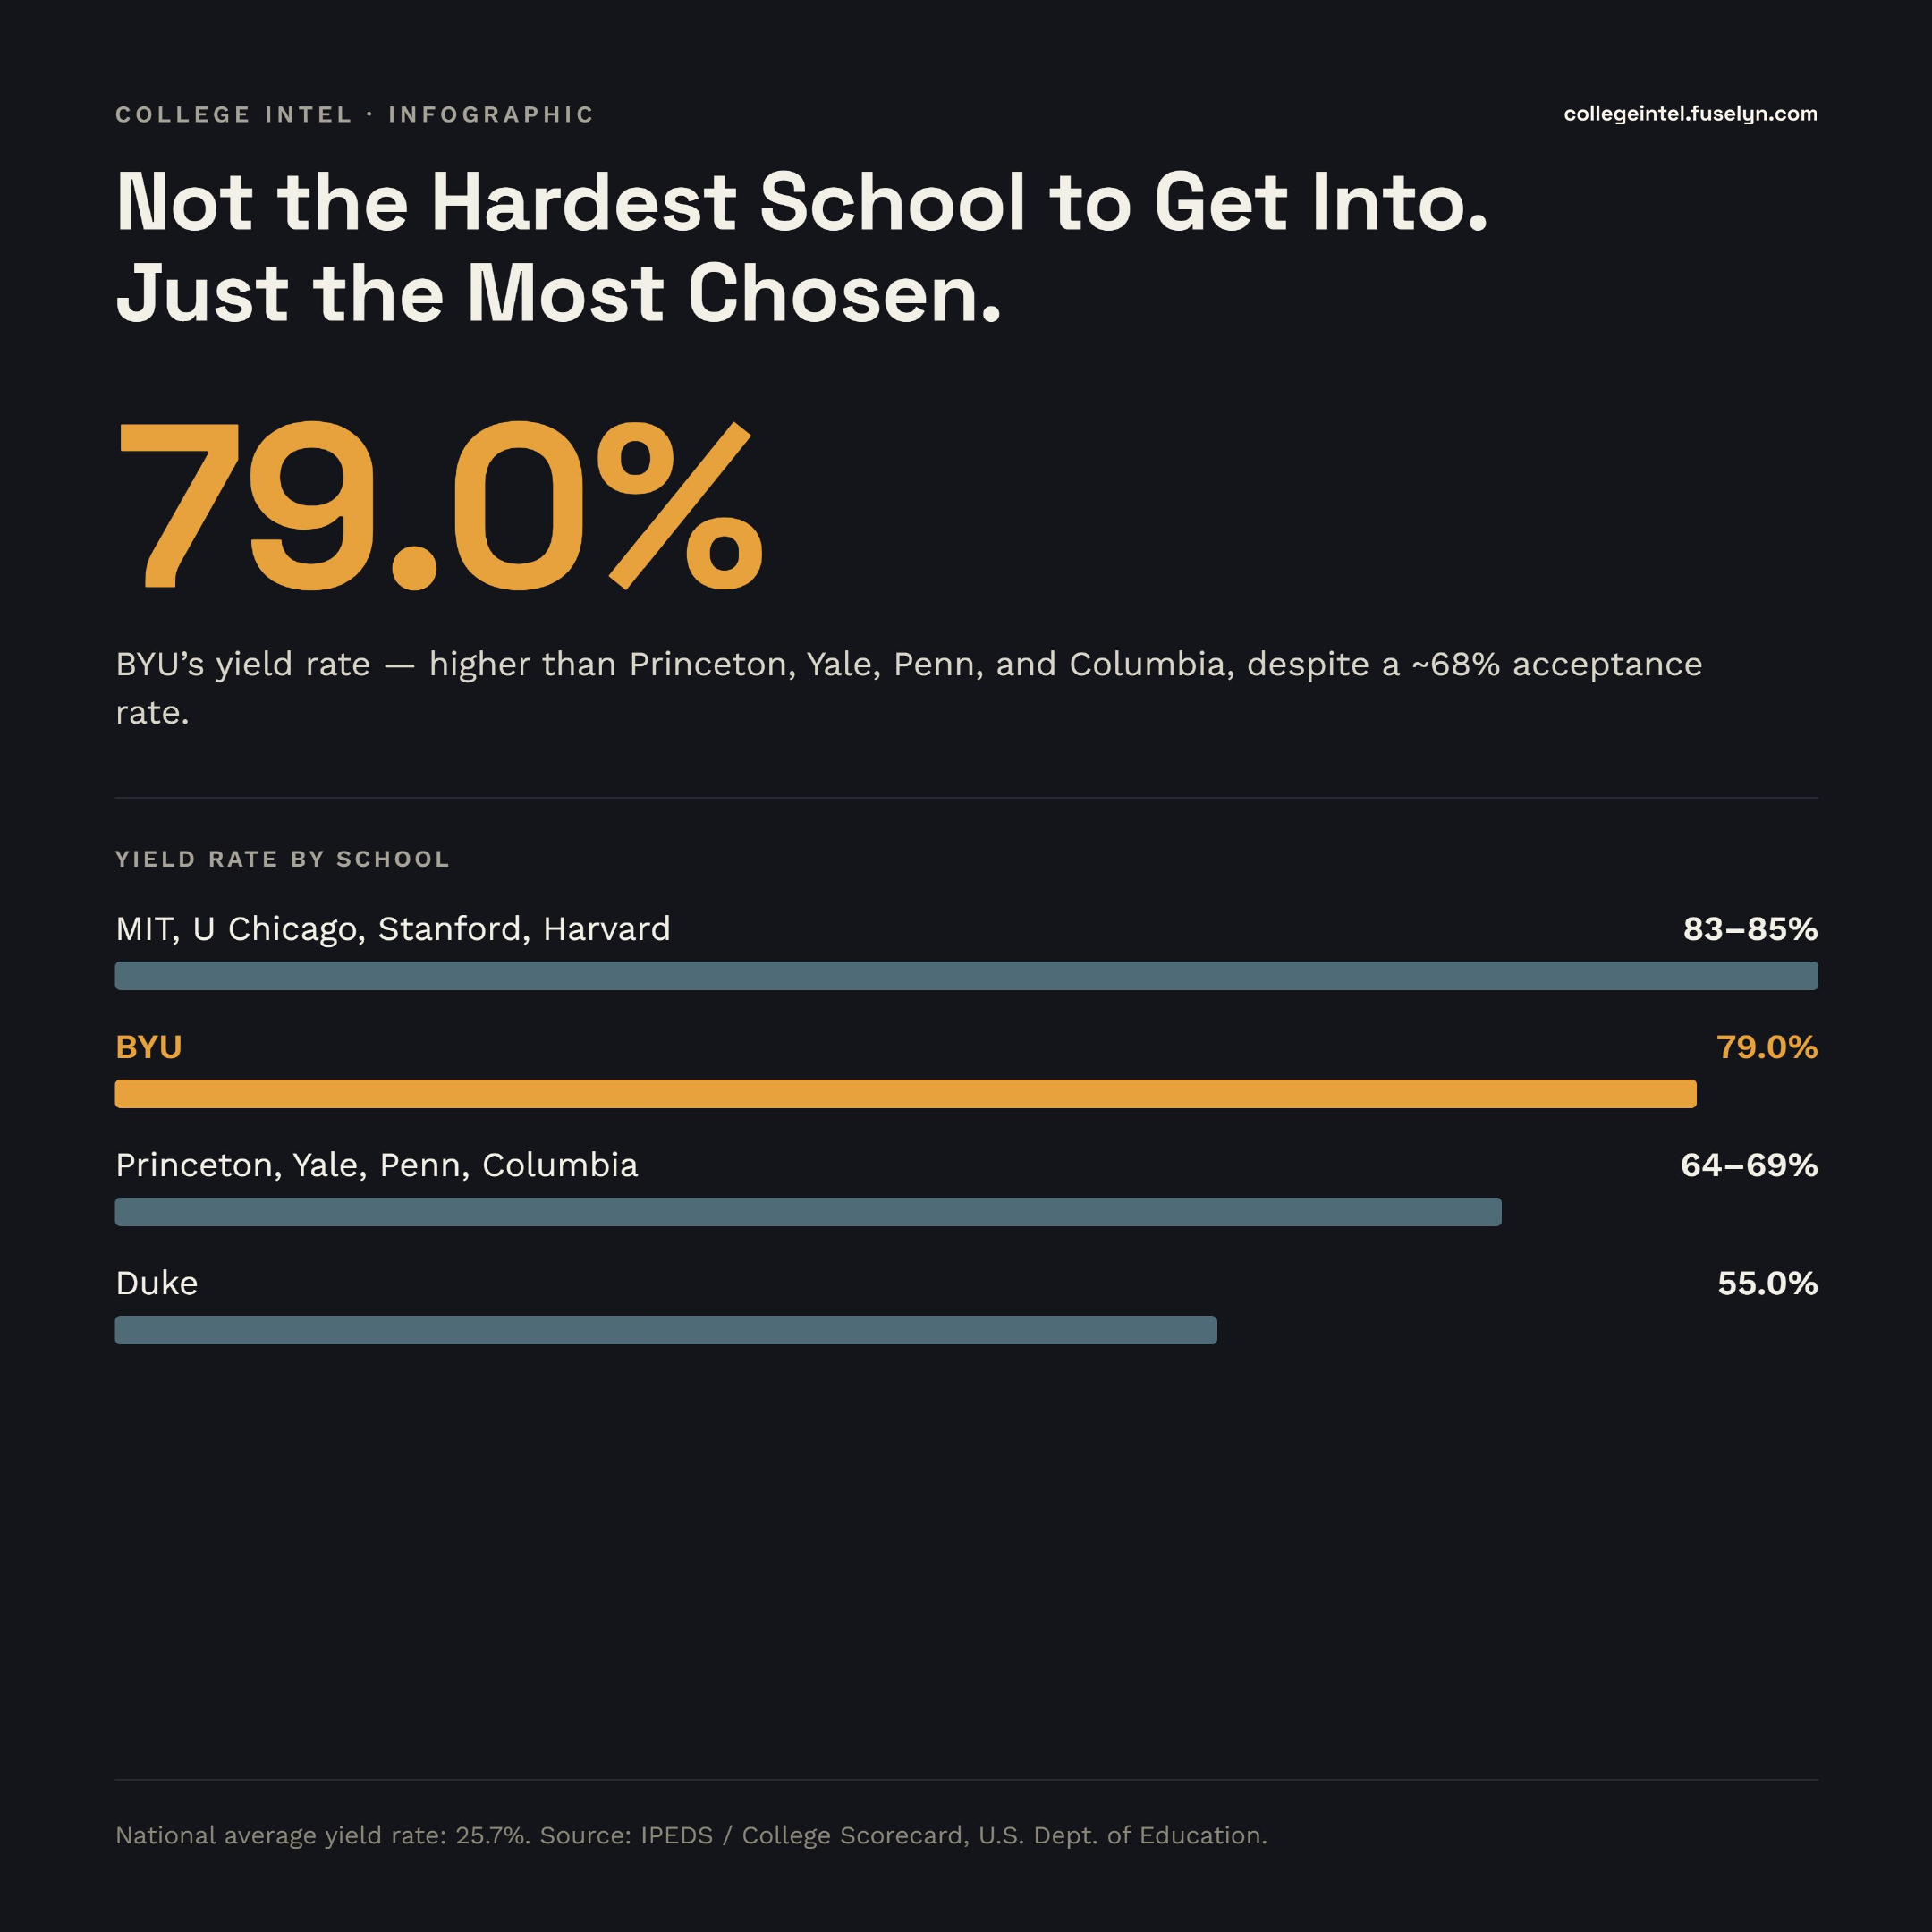
Not the Hardest School to Get Into. Just the Most Chosen.

BYU converts 79% of its admits into enrolled students -- higher than Princeton, Yale, Penn, and Columbia, despite an acceptance rate around 68%. See the full breakdown, and why selectivity alone doesn't explain the gap, in our full article. Read the full article.
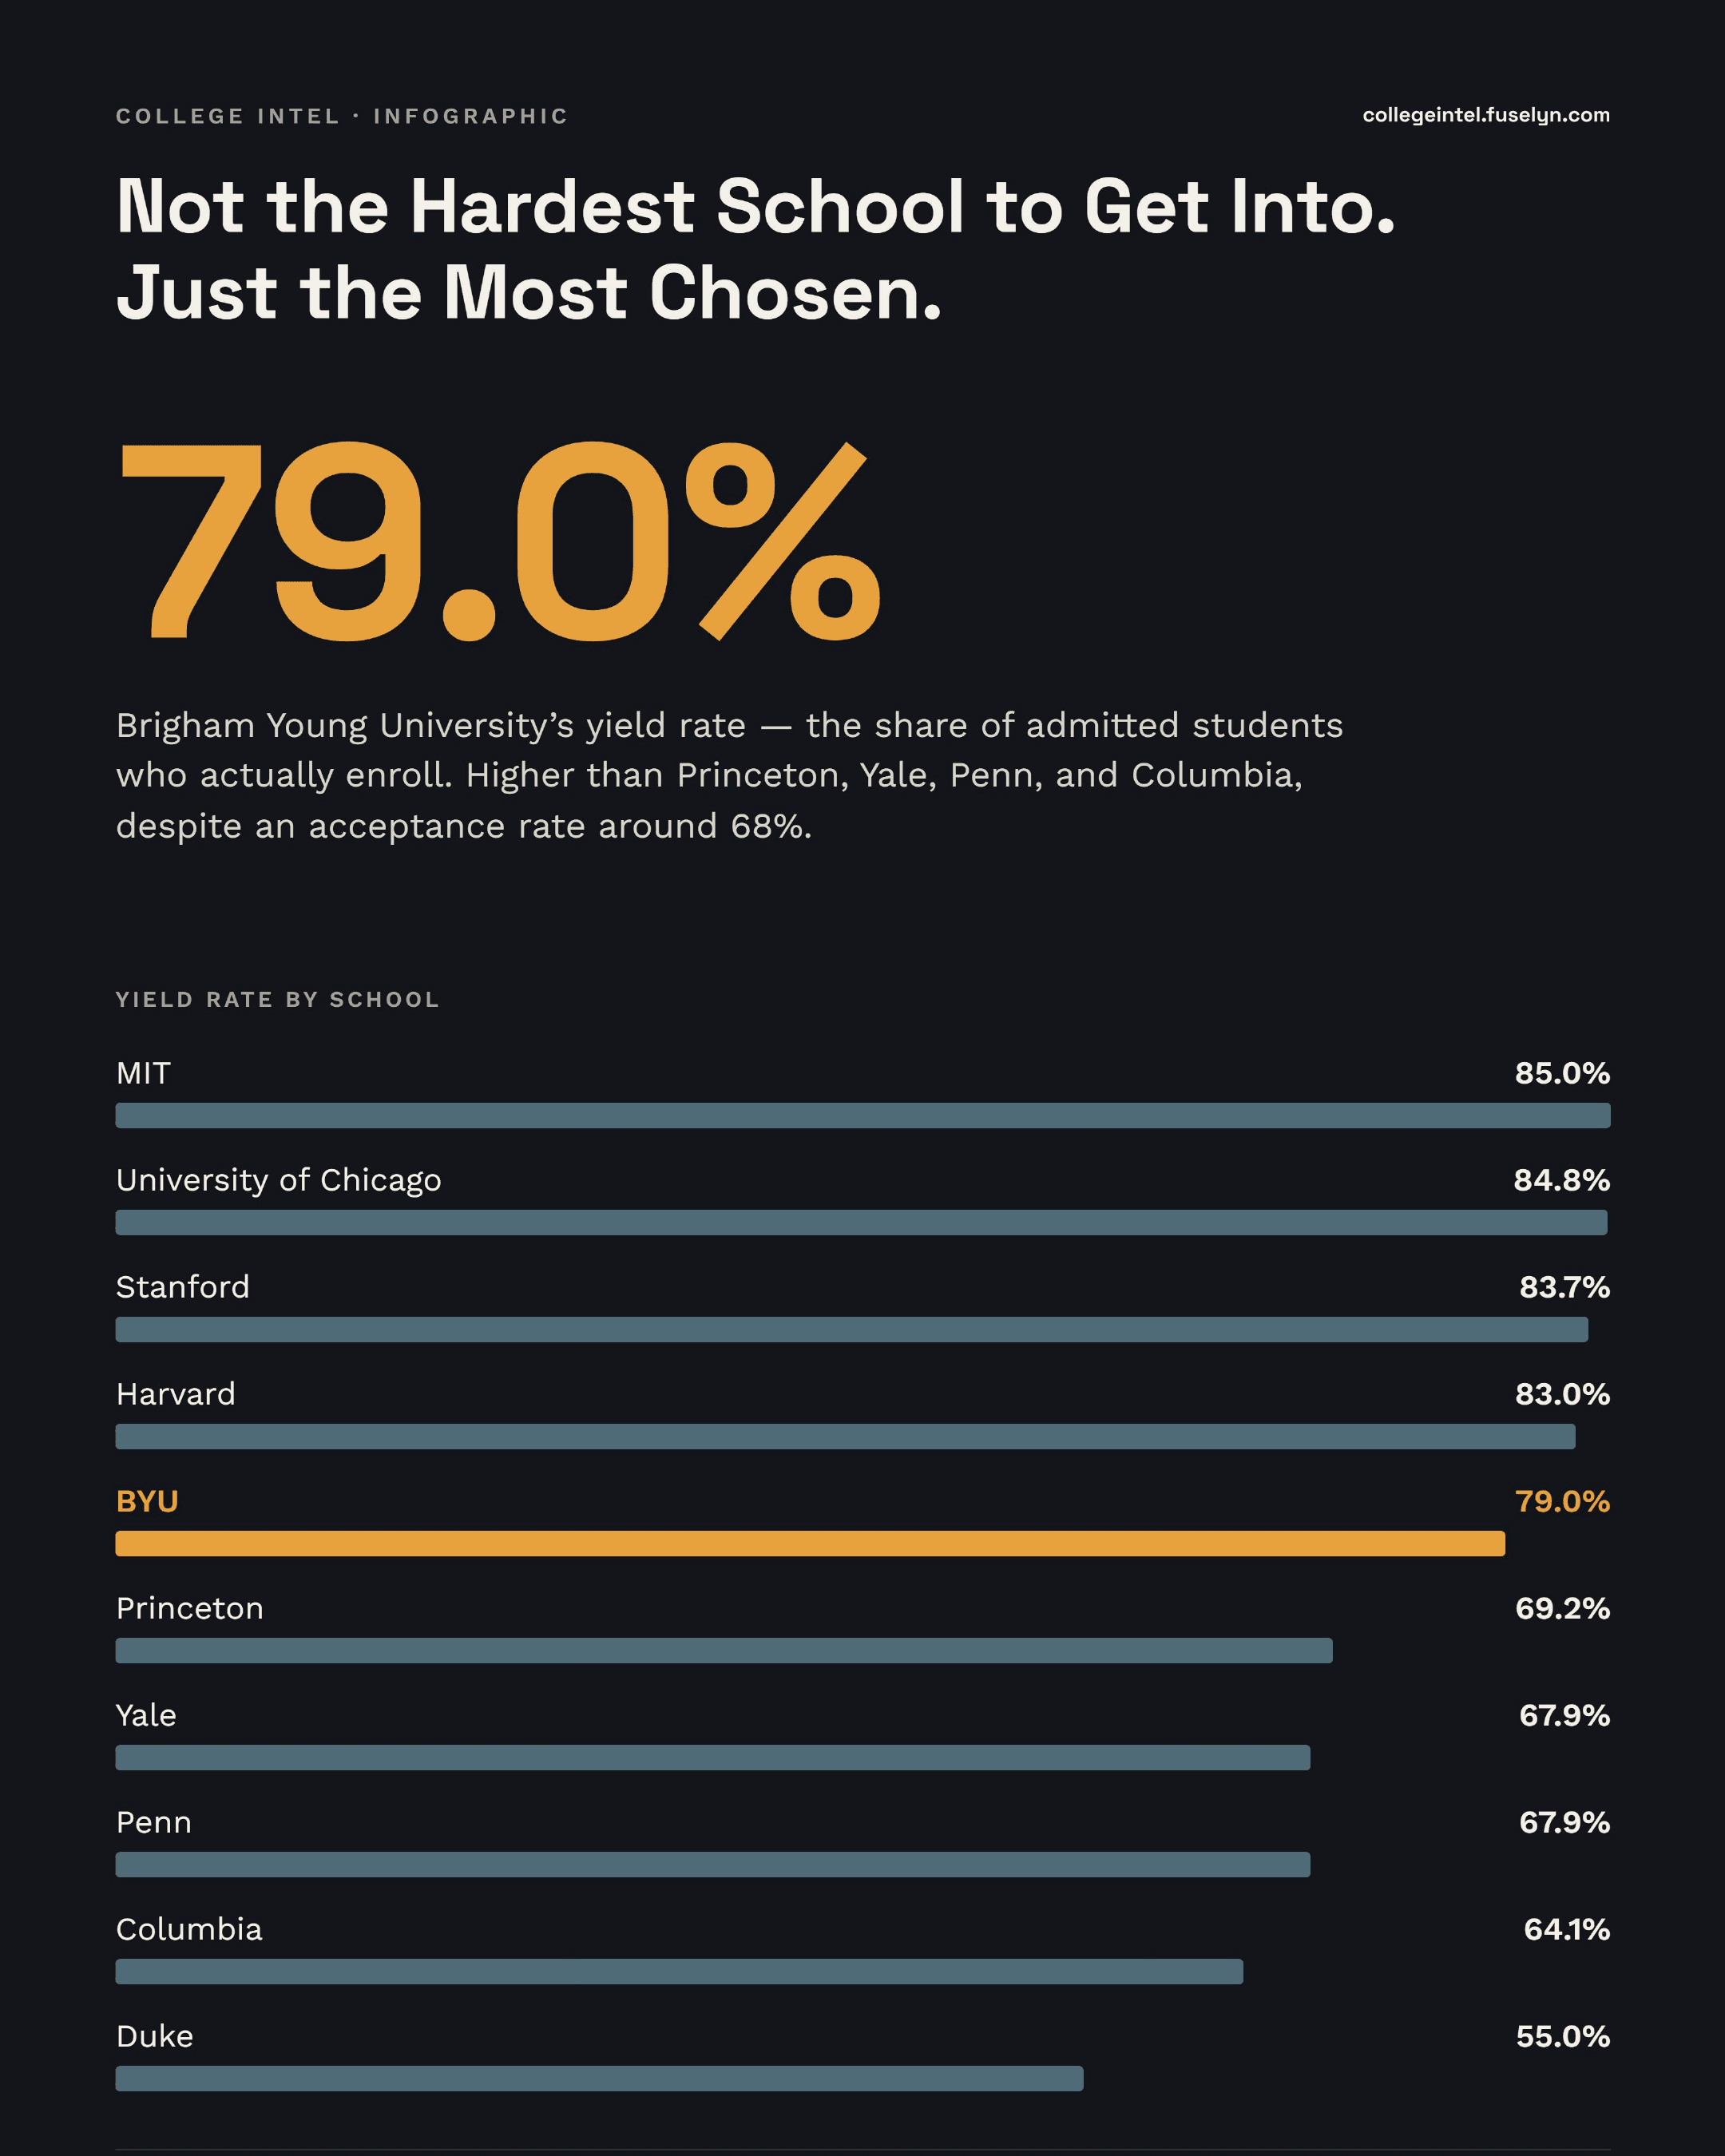
Infographic titled 'Not the Hardest School to Get Into. Just the Most Chosen.' 79.0% -- BYU's yield rate, the share of admitted students who actually enroll, higher than Princeton, Yale, Penn, and Columbia despite an acceptance rate around 68%. Yield rate by school: MIT 85.0%, University of Chicago 84.8%, Stanford 83.7%, Harvard 83.0%, BYU 79.0%, Princeton 69.2%, Yale 67.9%, Penn 67.9%, Columbia 64.1%, Duke 55.0%. Footnote: national average yield rate is 25.7%; even the least-selective schools (over 80% admit rate) average only 23.1%, so selectivity alone doesn't explain BYU beating four Ivies here.
Download printable PDFDownload for social (square)

Source: IPEDS / College Scorecard, U.S. Dept. of Education.

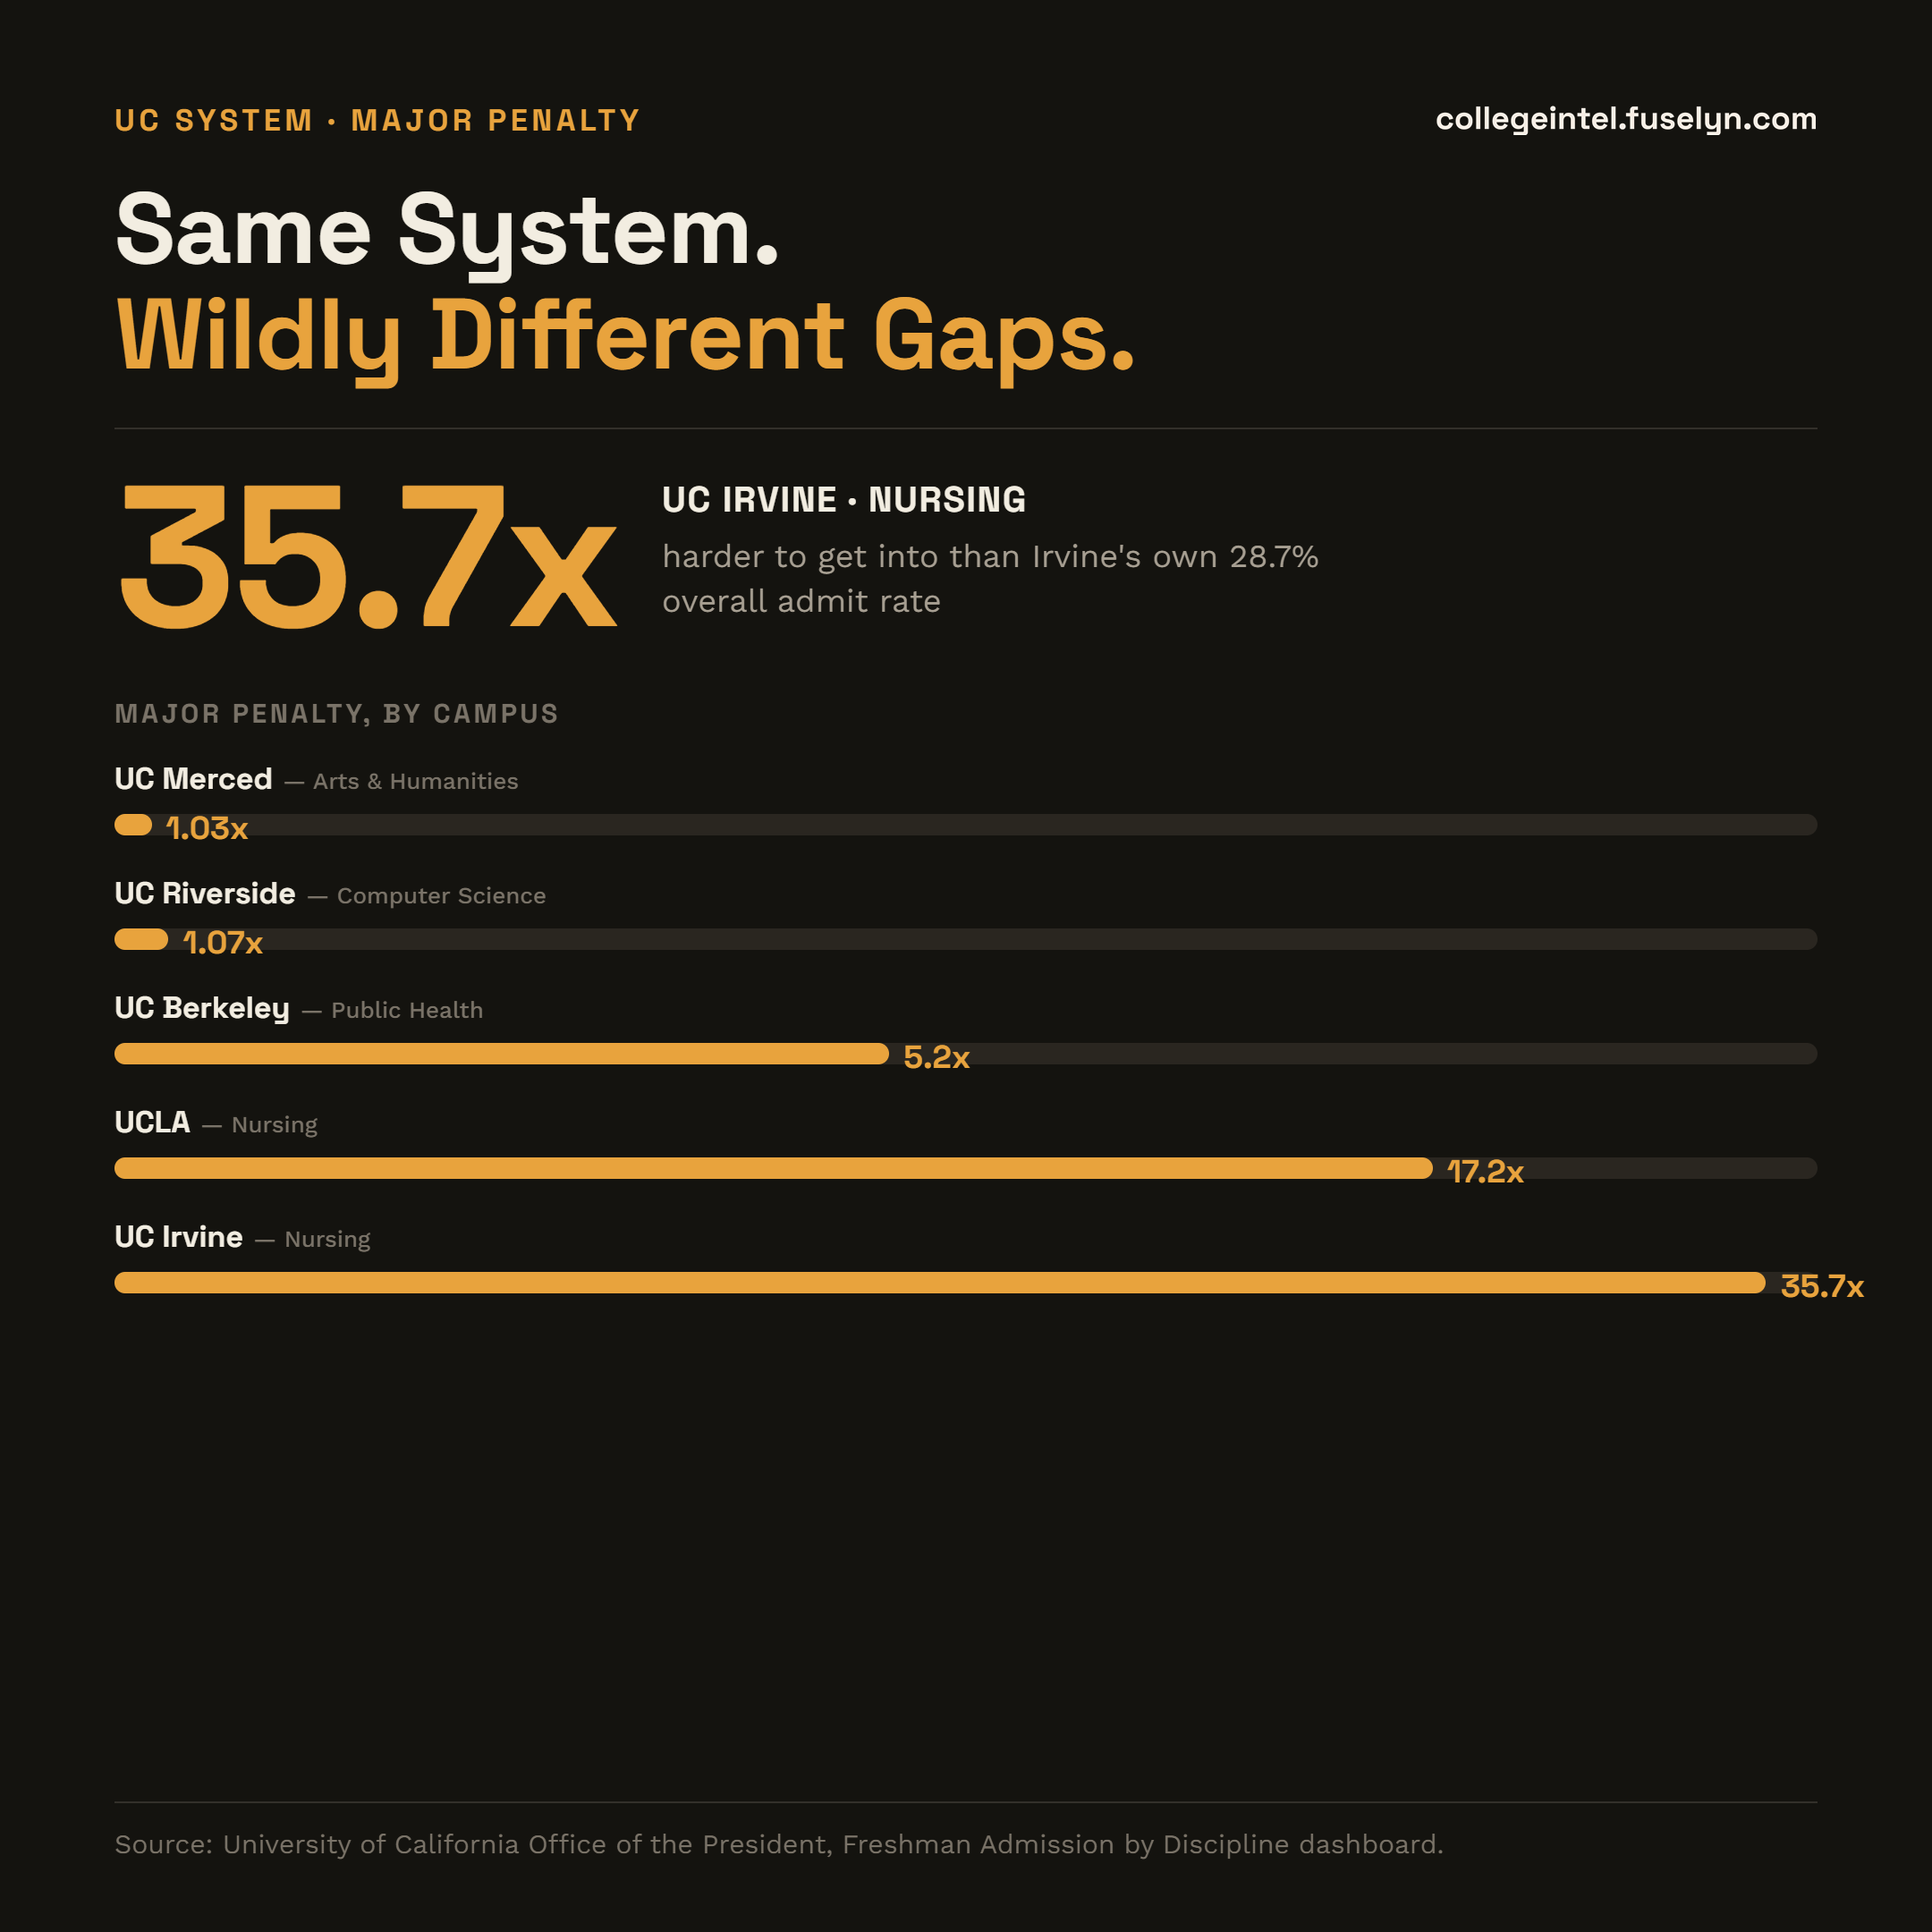
Same System. Wildly Different Gaps.

Every UC campus publishes the same admit-rate-by-major data -- but at UC Merced a competitive major is barely harder than the campus average, while at UC Irvine, Nursing admits at 1/36th the campus's own overall rate. See the full pattern, ranked across five UC campuses, in our full article. Read the full article.
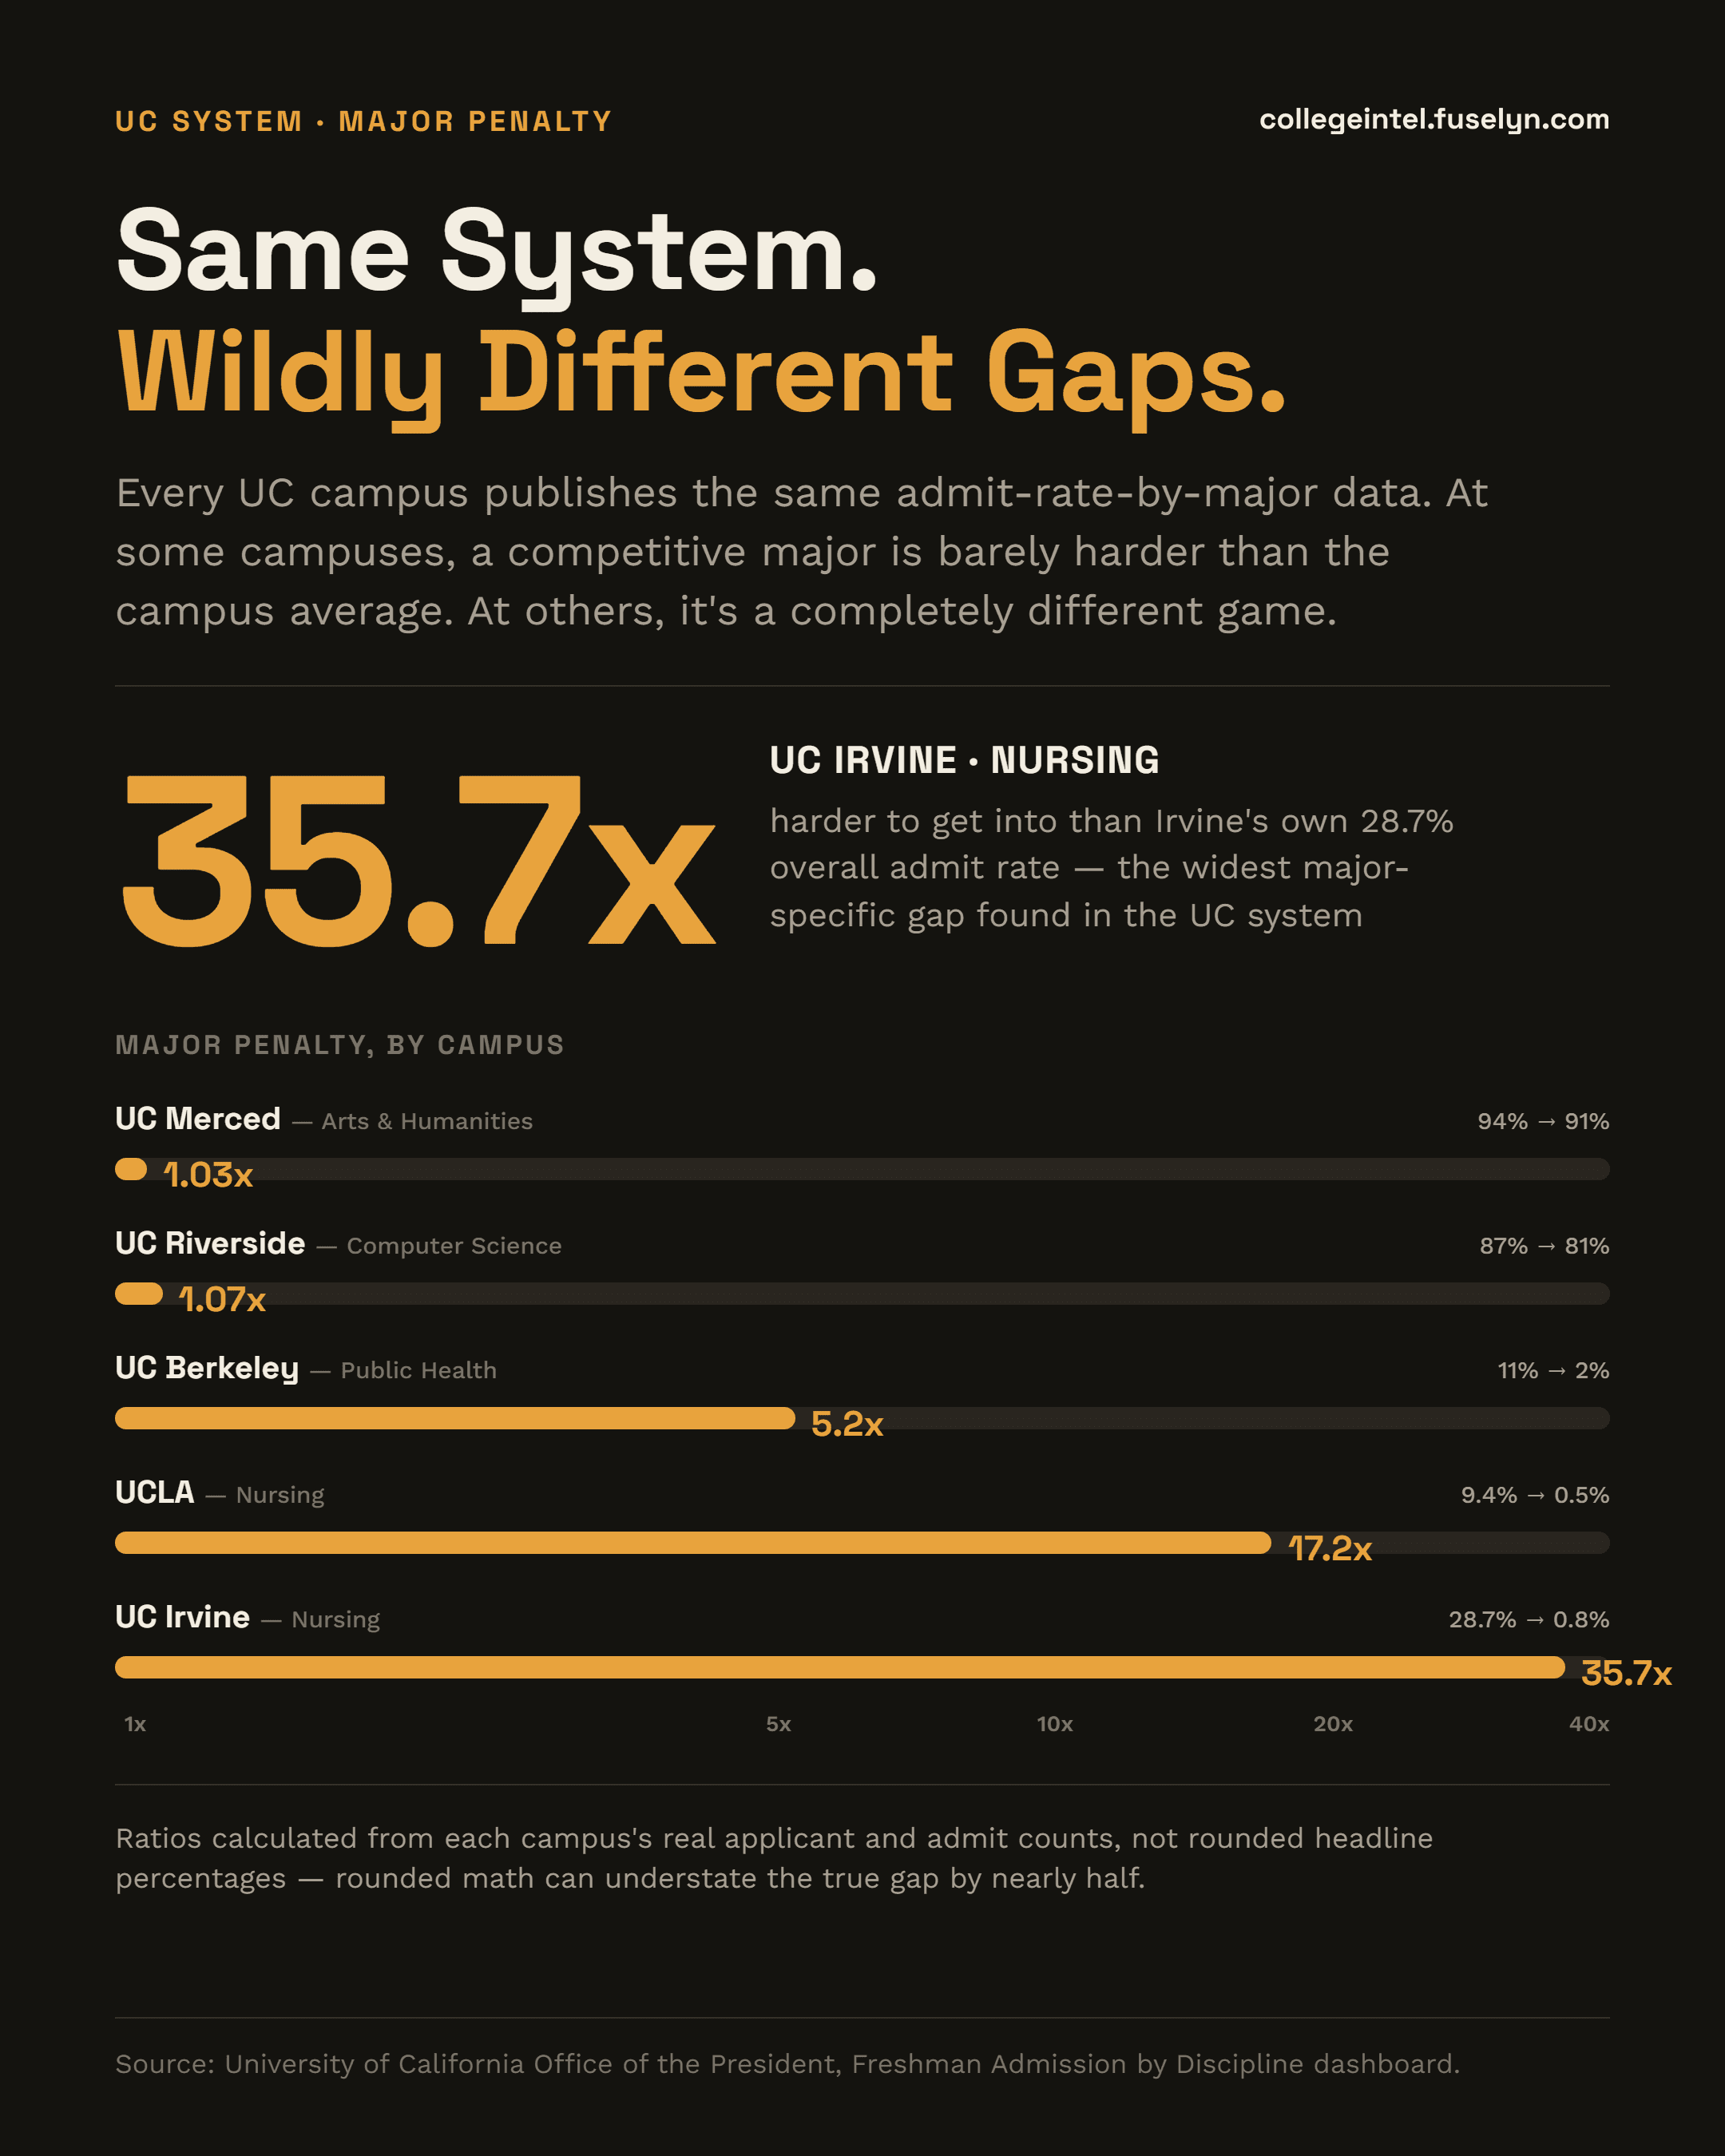
Infographic titled 'Same System. Wildly Different Gaps.' 35.7x -- UC Irvine Nursing is 35.7 times harder to get into than Irvine's own 28.7% overall admit rate, the widest major-specific gap found in the UC system. Major penalty by campus, ranked on a log scale: UC Merced Arts & Humanities 94% to 91%, 1.03x; UC Riverside Computer Science 87% to 81%, 1.07x; UC Berkeley Public Health 11% to 2%, 5.2x; UCLA Nursing 9.4% to 0.5%, 17.2x; UC Irvine Nursing 28.7% to 0.8%, 35.7x. Footnote: ratios calculated from each campus's real applicant and admit counts, not rounded headline percentages.
Download printable PDFDownload for social (square)

Source: University of California Office of the President, Freshman Admission by Discipline dashboard.

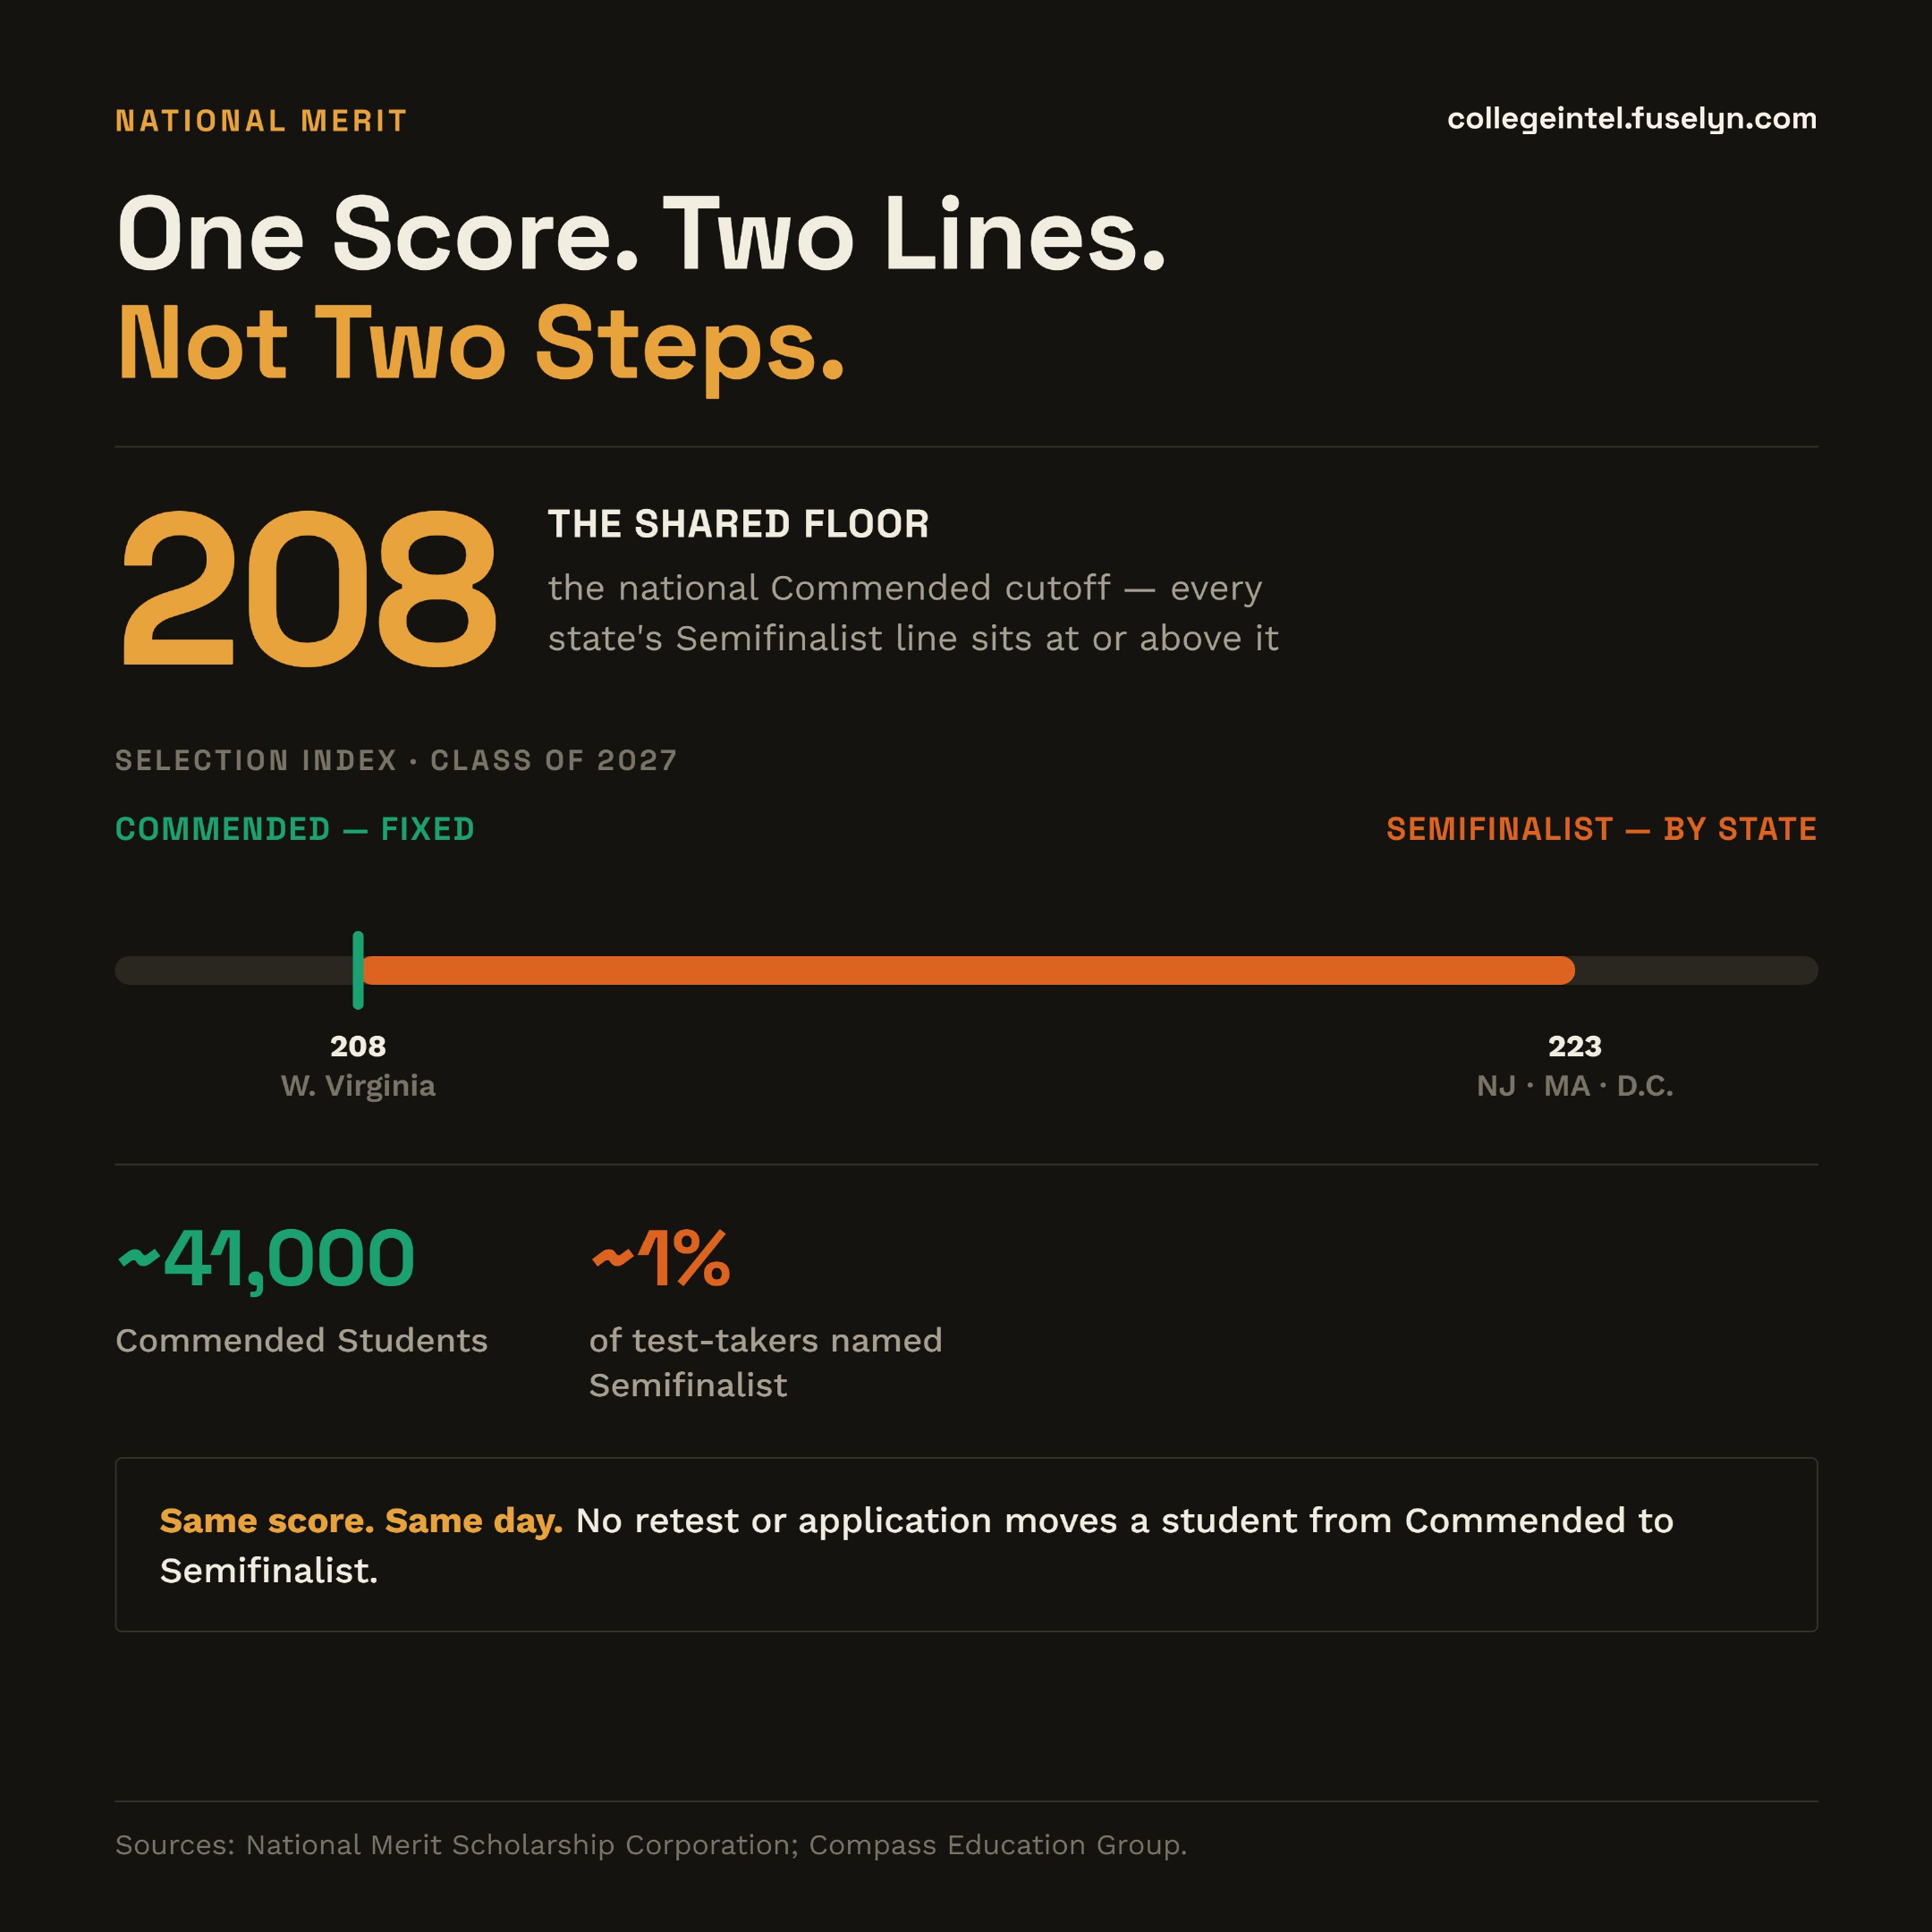
One Score. Two Lines. Not Two Steps.

Commended Student and Semifinalist aren't sequential stages -- both come from the exact same PSAT/NMSQT score, checked against two different cutoff lines, decided the moment scores are released. See the full mechanism, and the one state where the two lines actually meet, in our full article. Read the full article.
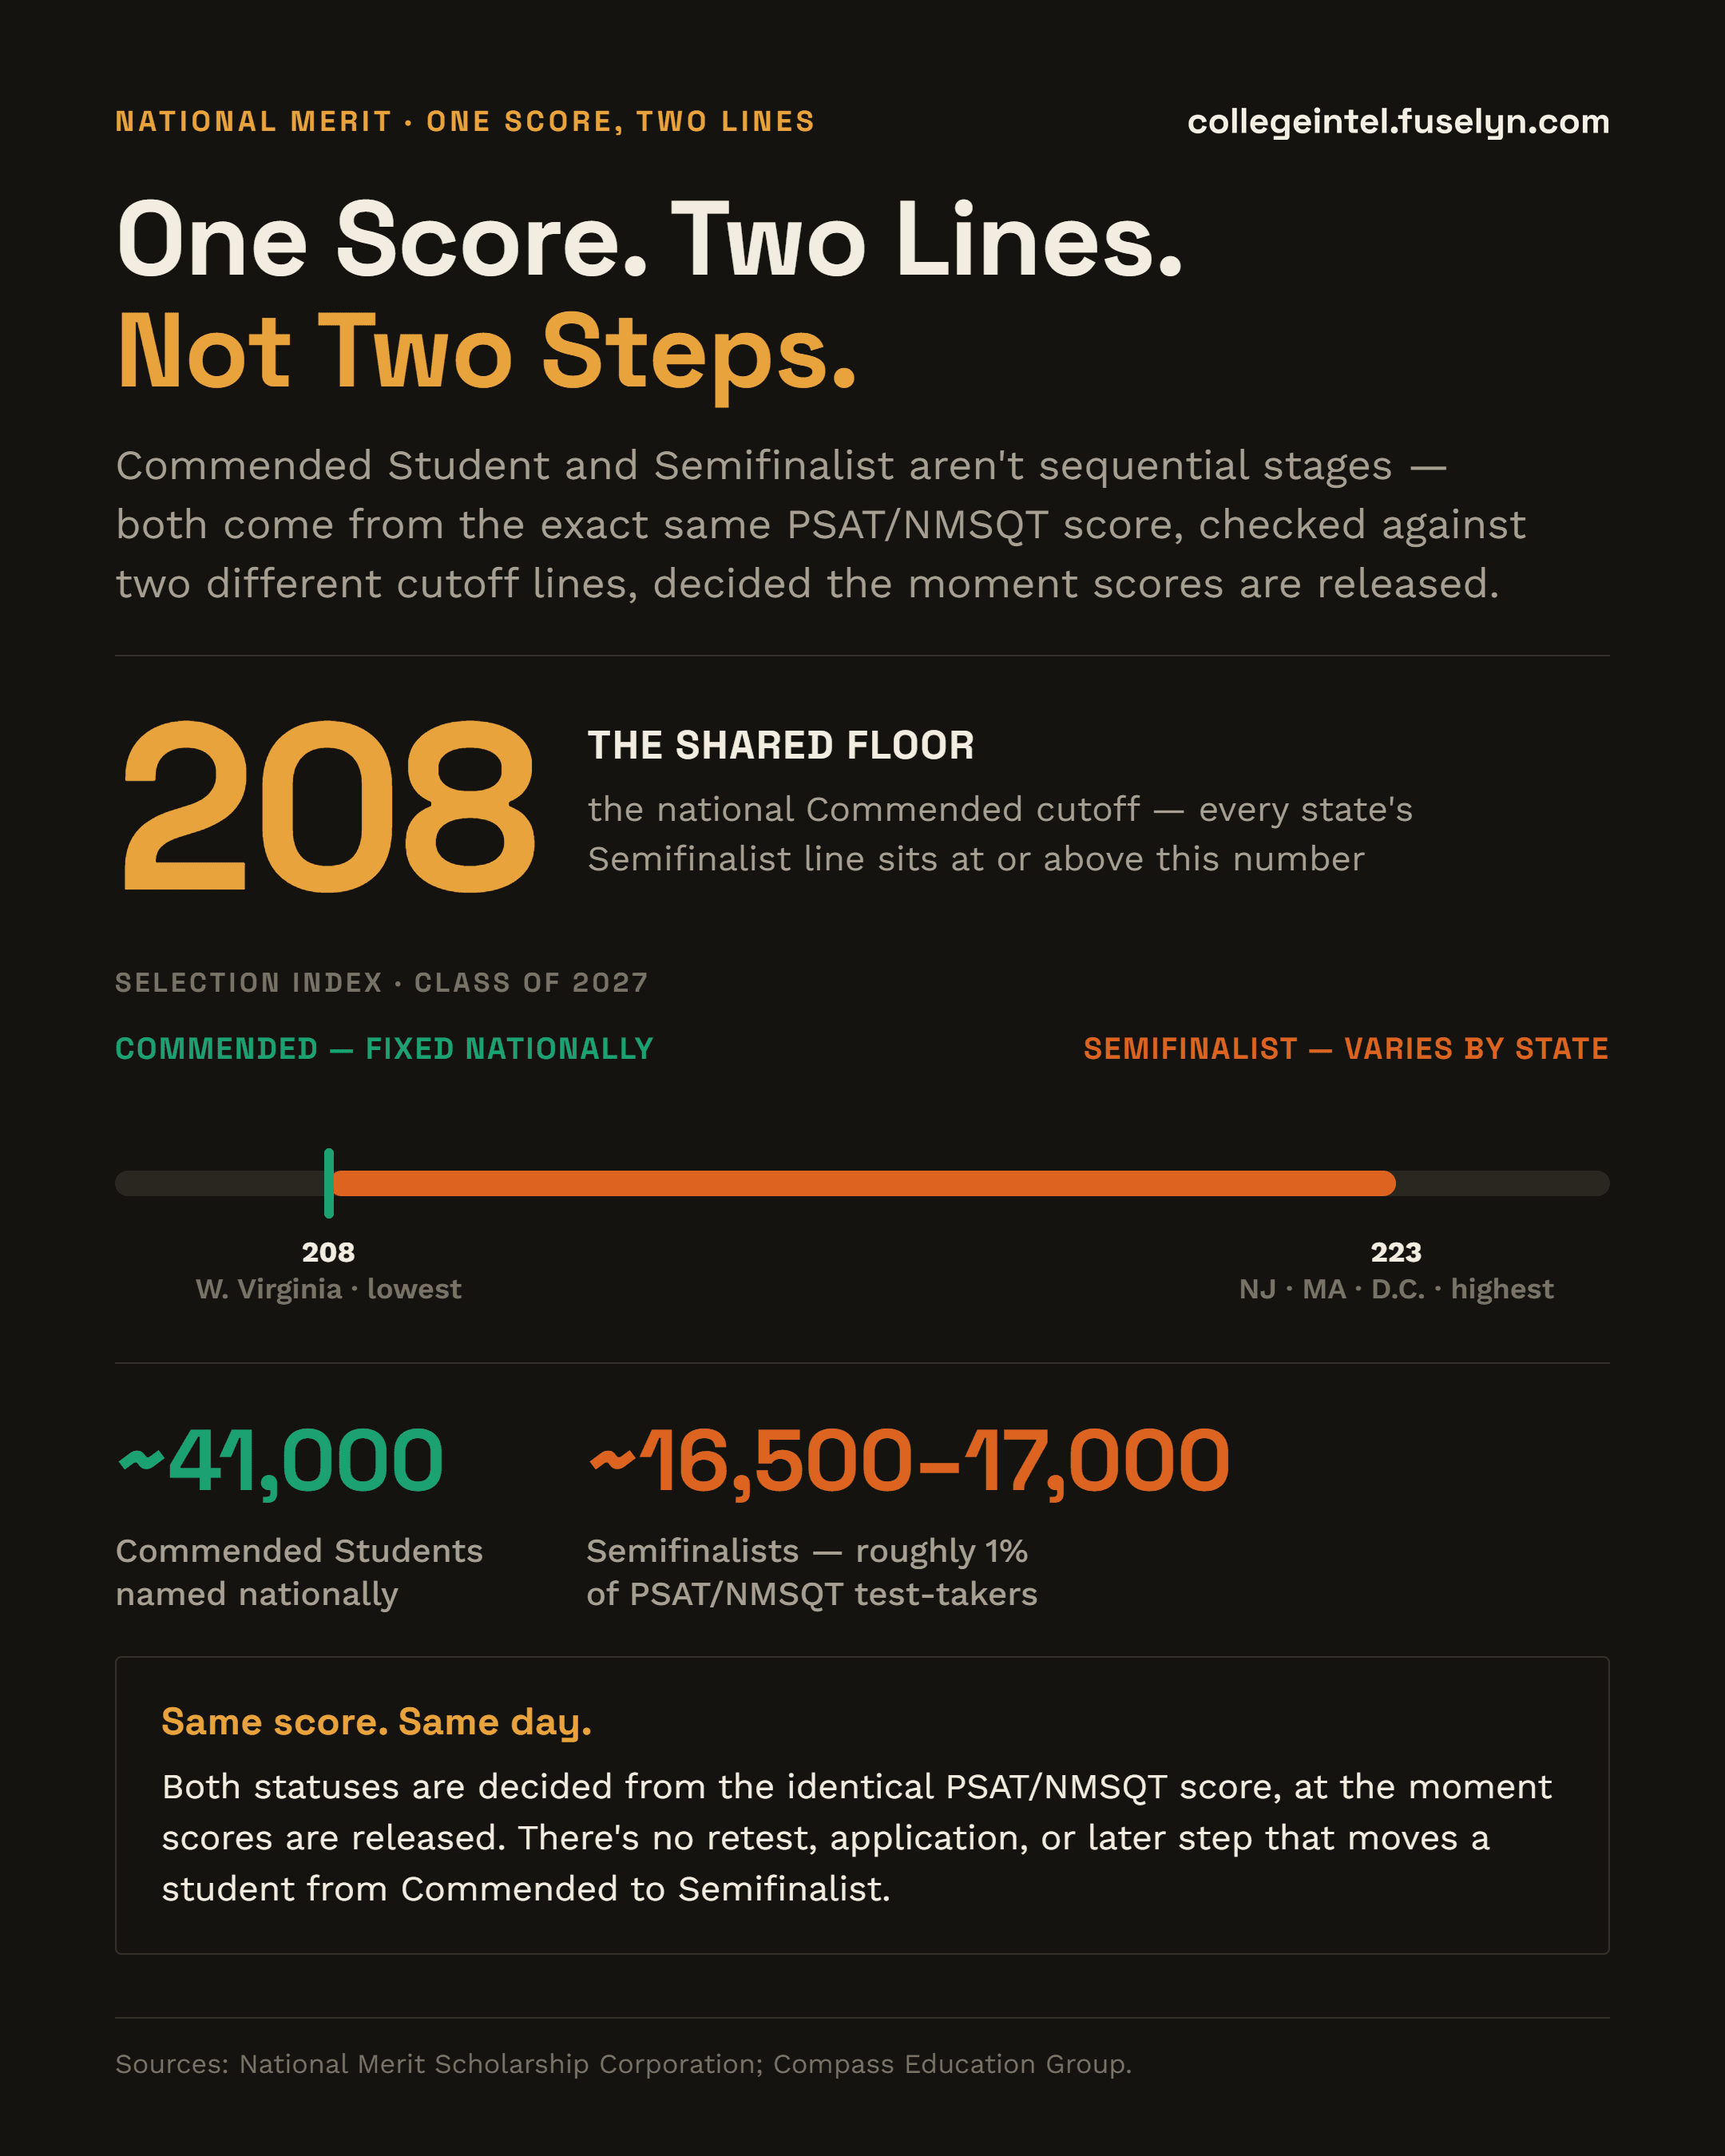
Infographic titled 'One Score. Two Lines. Not Two Steps.' 208 is the national Commended cutoff -- the floor every state's Semifinalist line sits at or above. Selection Index diagram, Class of 2027: Commended fixed nationally at 208; Semifinalist varies by state from 208 (West Virginia, lowest) to 223 (New Jersey, Massachusetts, D.C., highest). Roughly 41,000 Commended Students named nationally; roughly 16,500-17,000 Semifinalists, about 1% of PSAT/NMSQT test-takers. Callout: Same score, same day -- both statuses are decided from the identical PSAT/NMSQT score, at the moment scores are released; there's no retest, application, or later step that moves a student from Commended to Semifinalist.
Download printable PDFDownload for social (square)

Sources: National Merit Scholarship Corporation; Compass Education Group.

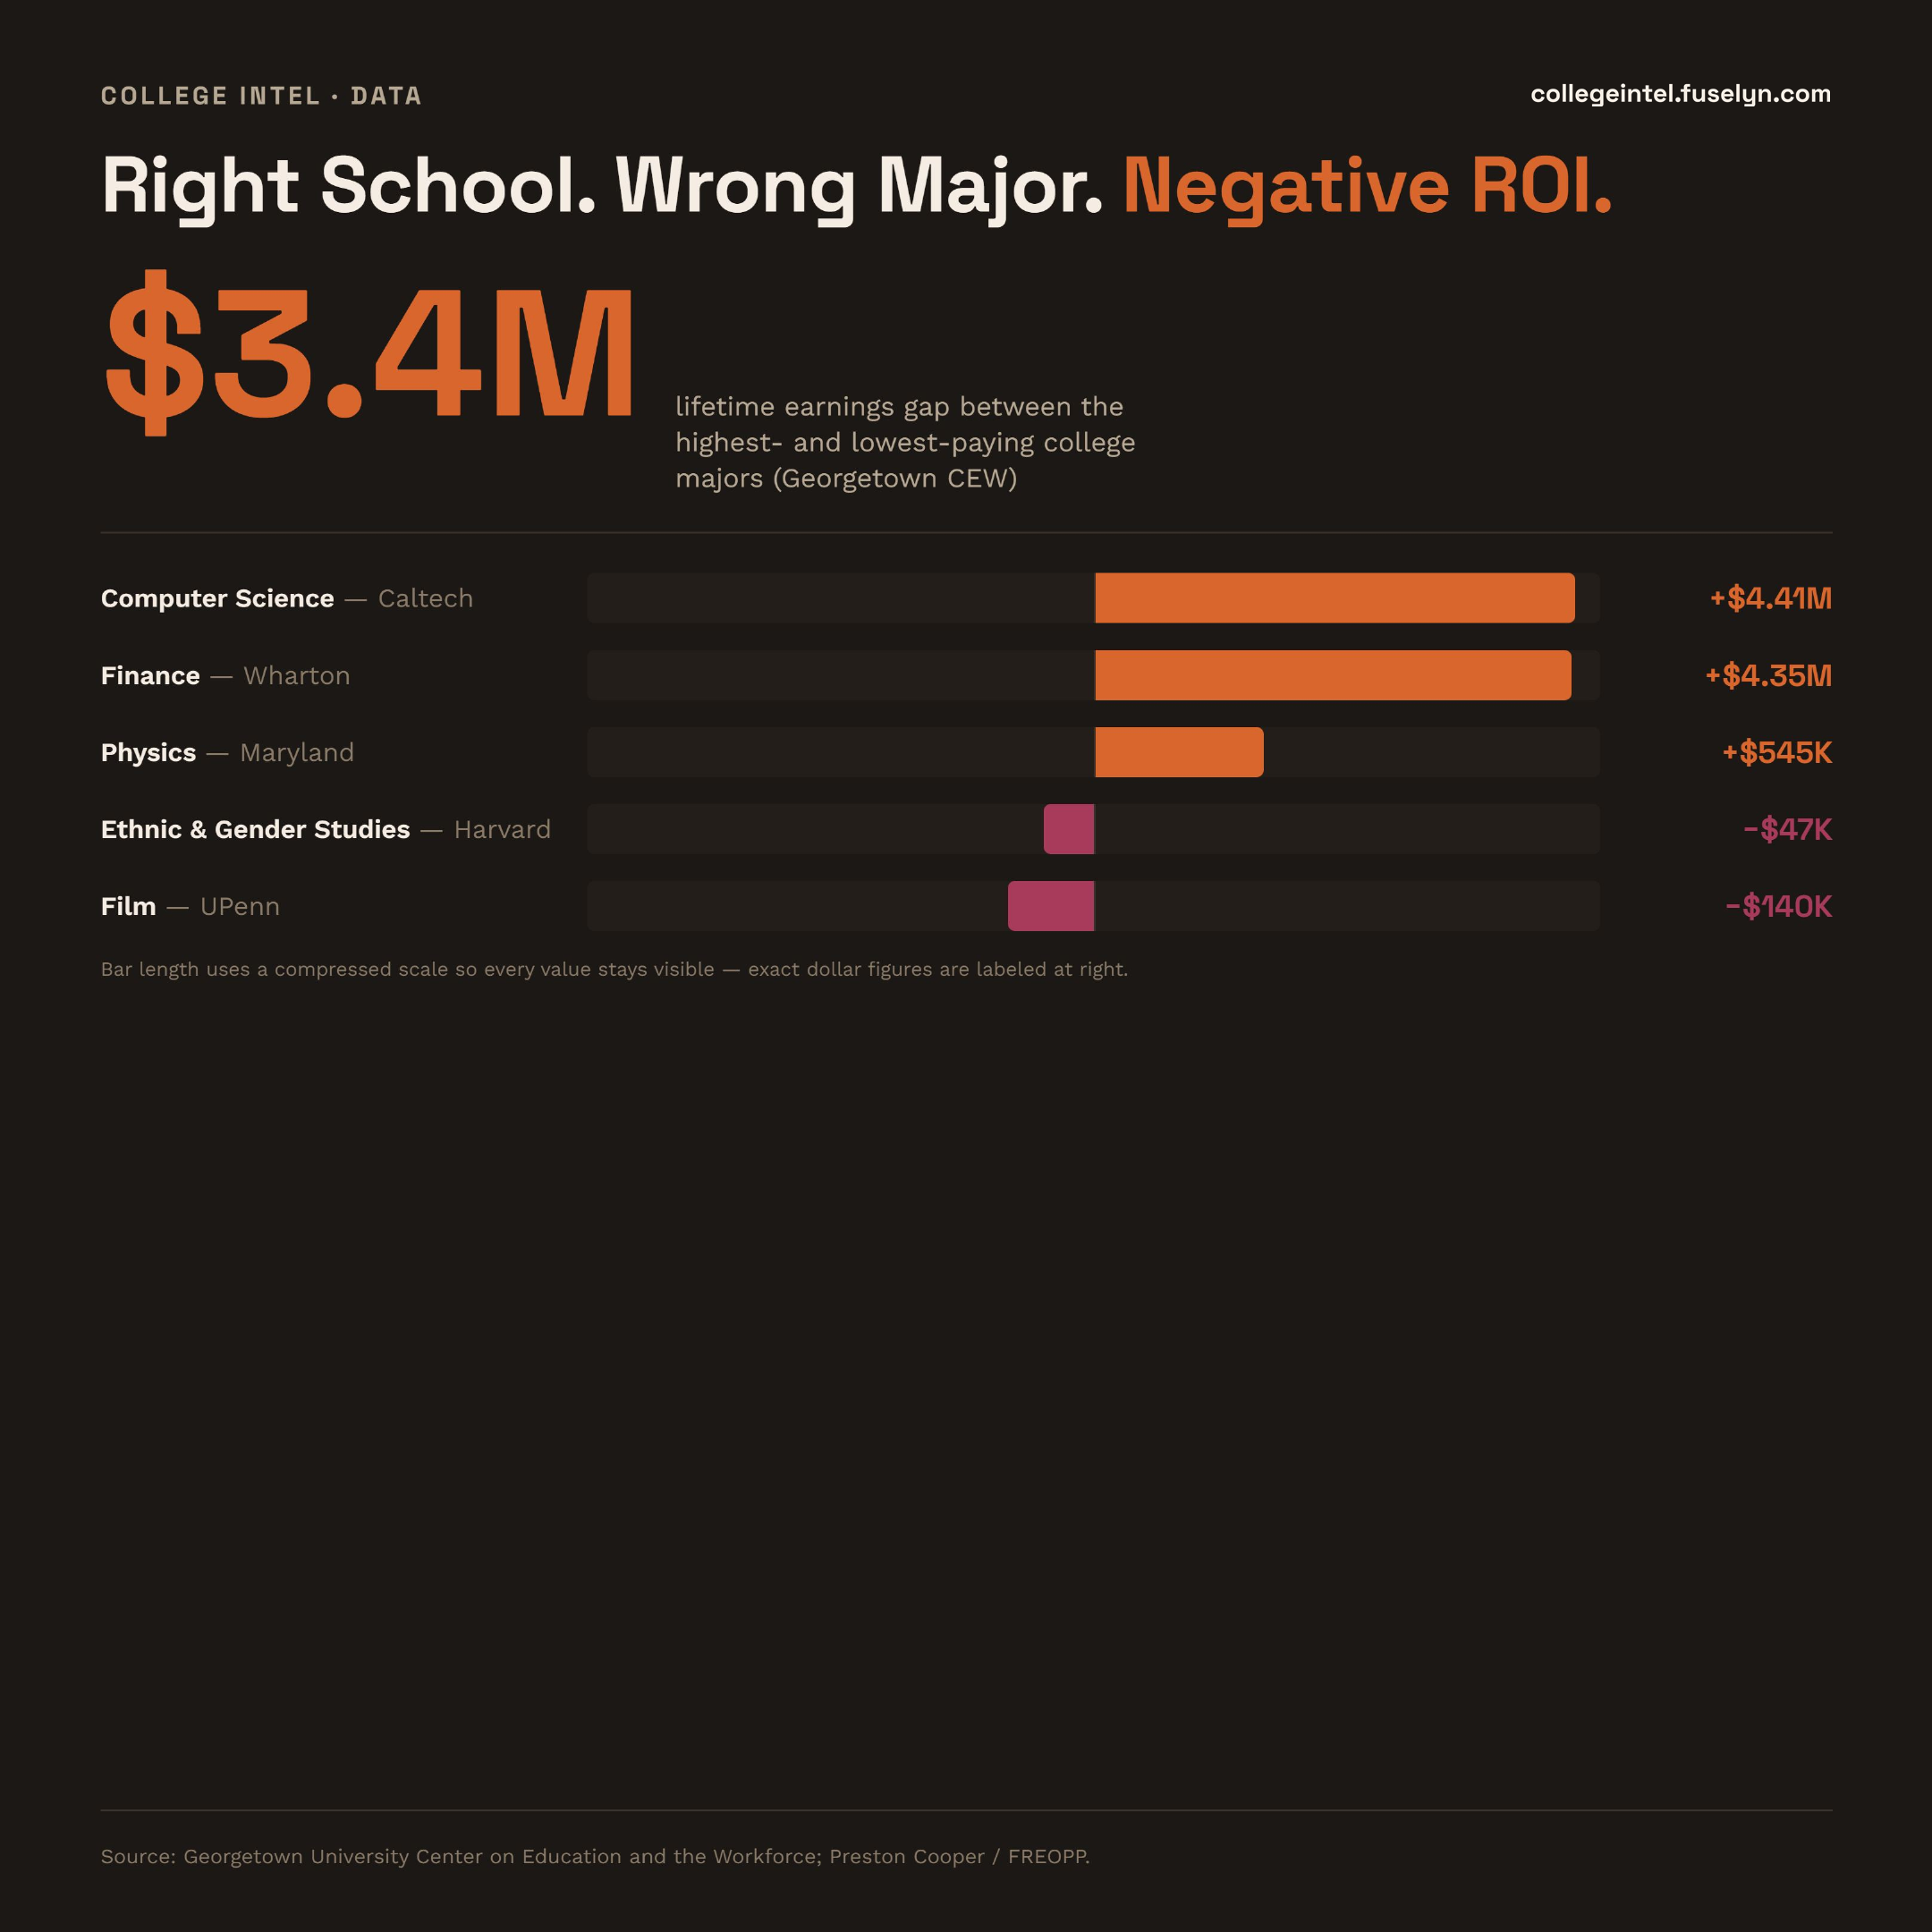
Right school. Wrong major. Negative ROI.

Georgetown's Center on Education and the Workforce puts the lifetime earnings gap between the best- and worst-paying college majors at $3.4 million -- and even at Harvard and Penn, specific majors show negative ROI. See the full breakdown, by school and major, in our full article. Read the full article.
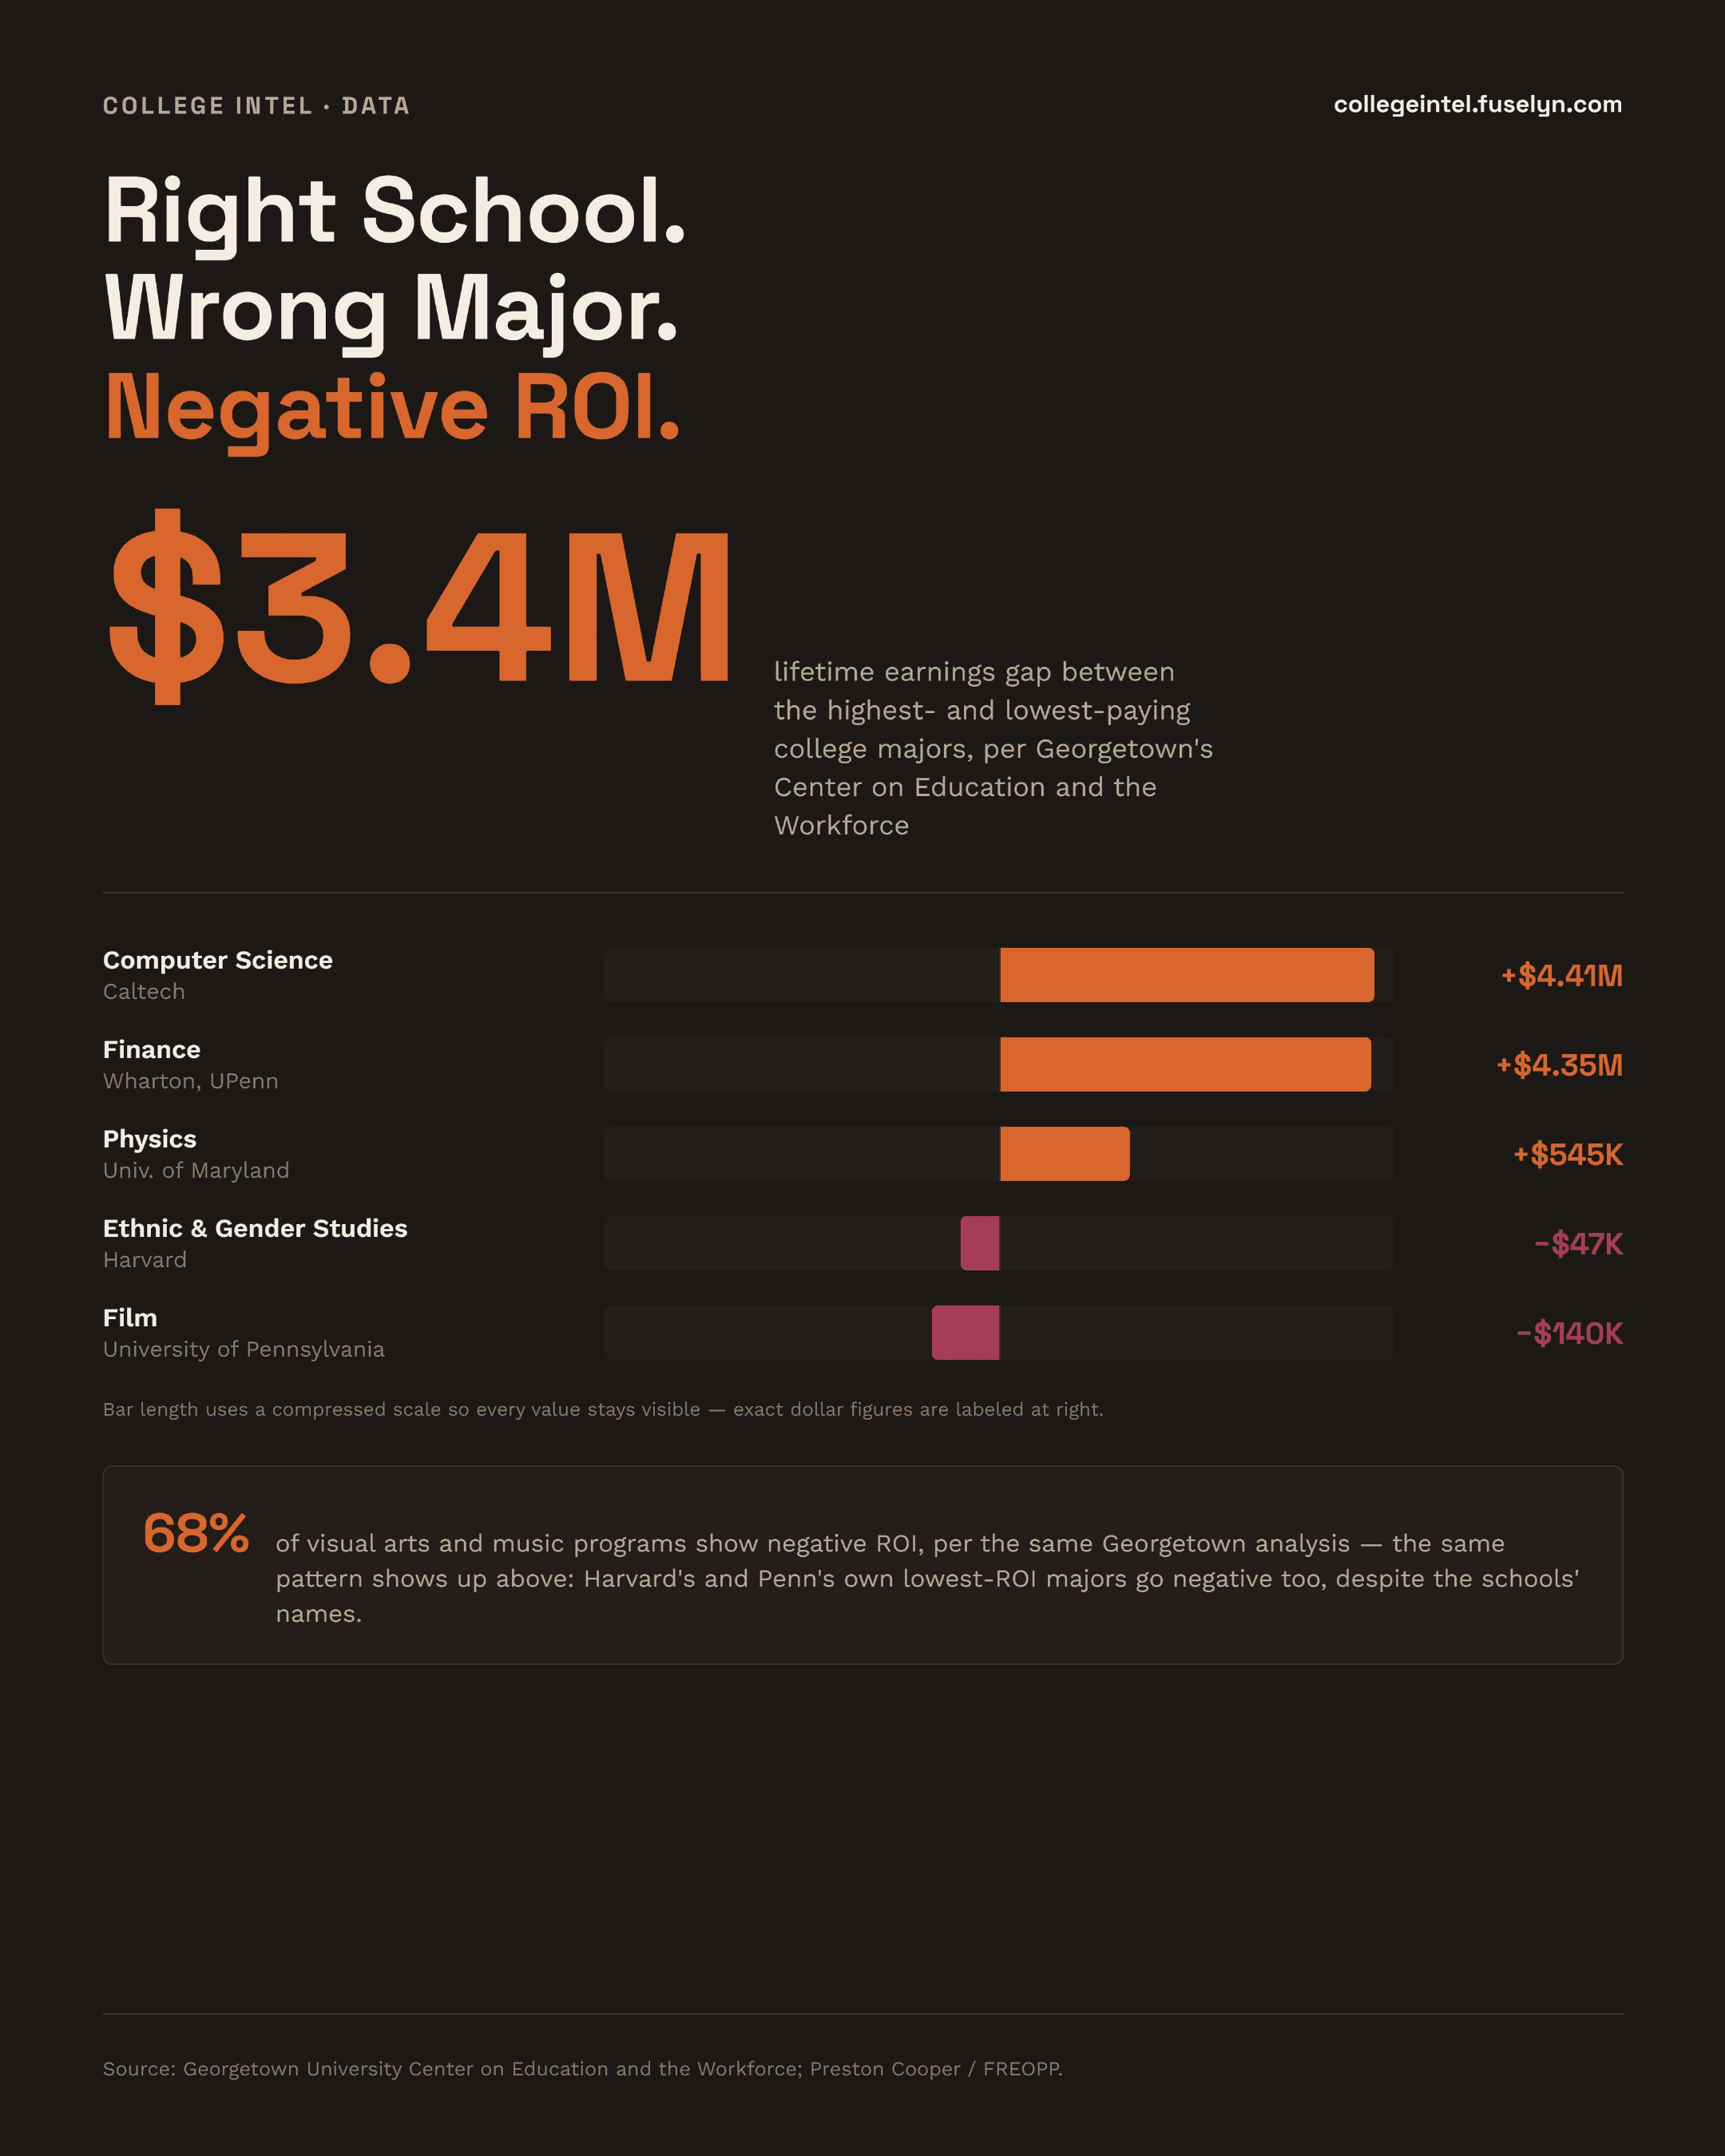
Infographic titled 'Right School. Wrong Major. Negative ROI.' $3.4M lifetime earnings gap between the highest- and lowest-paying college majors, per Georgetown's Center on Education and the Workforce. Highest ROI: Computer Science at Caltech +$4.41M, Finance at Wharton +$4.35M, Physics at Maryland +$545K. Lowest ROI: Ethnic & Gender Studies at Harvard -$47K, Film at UPenn -$140K. Callout: 68% of visual arts and music programs show negative ROI -- Harvard's and Penn's own lowest-ROI majors go negative too, despite the schools' names.
Download printable PDFDownload for social (square)

Sources: Georgetown University Center on Education and the Workforce, Preston Cooper/FREOPP.

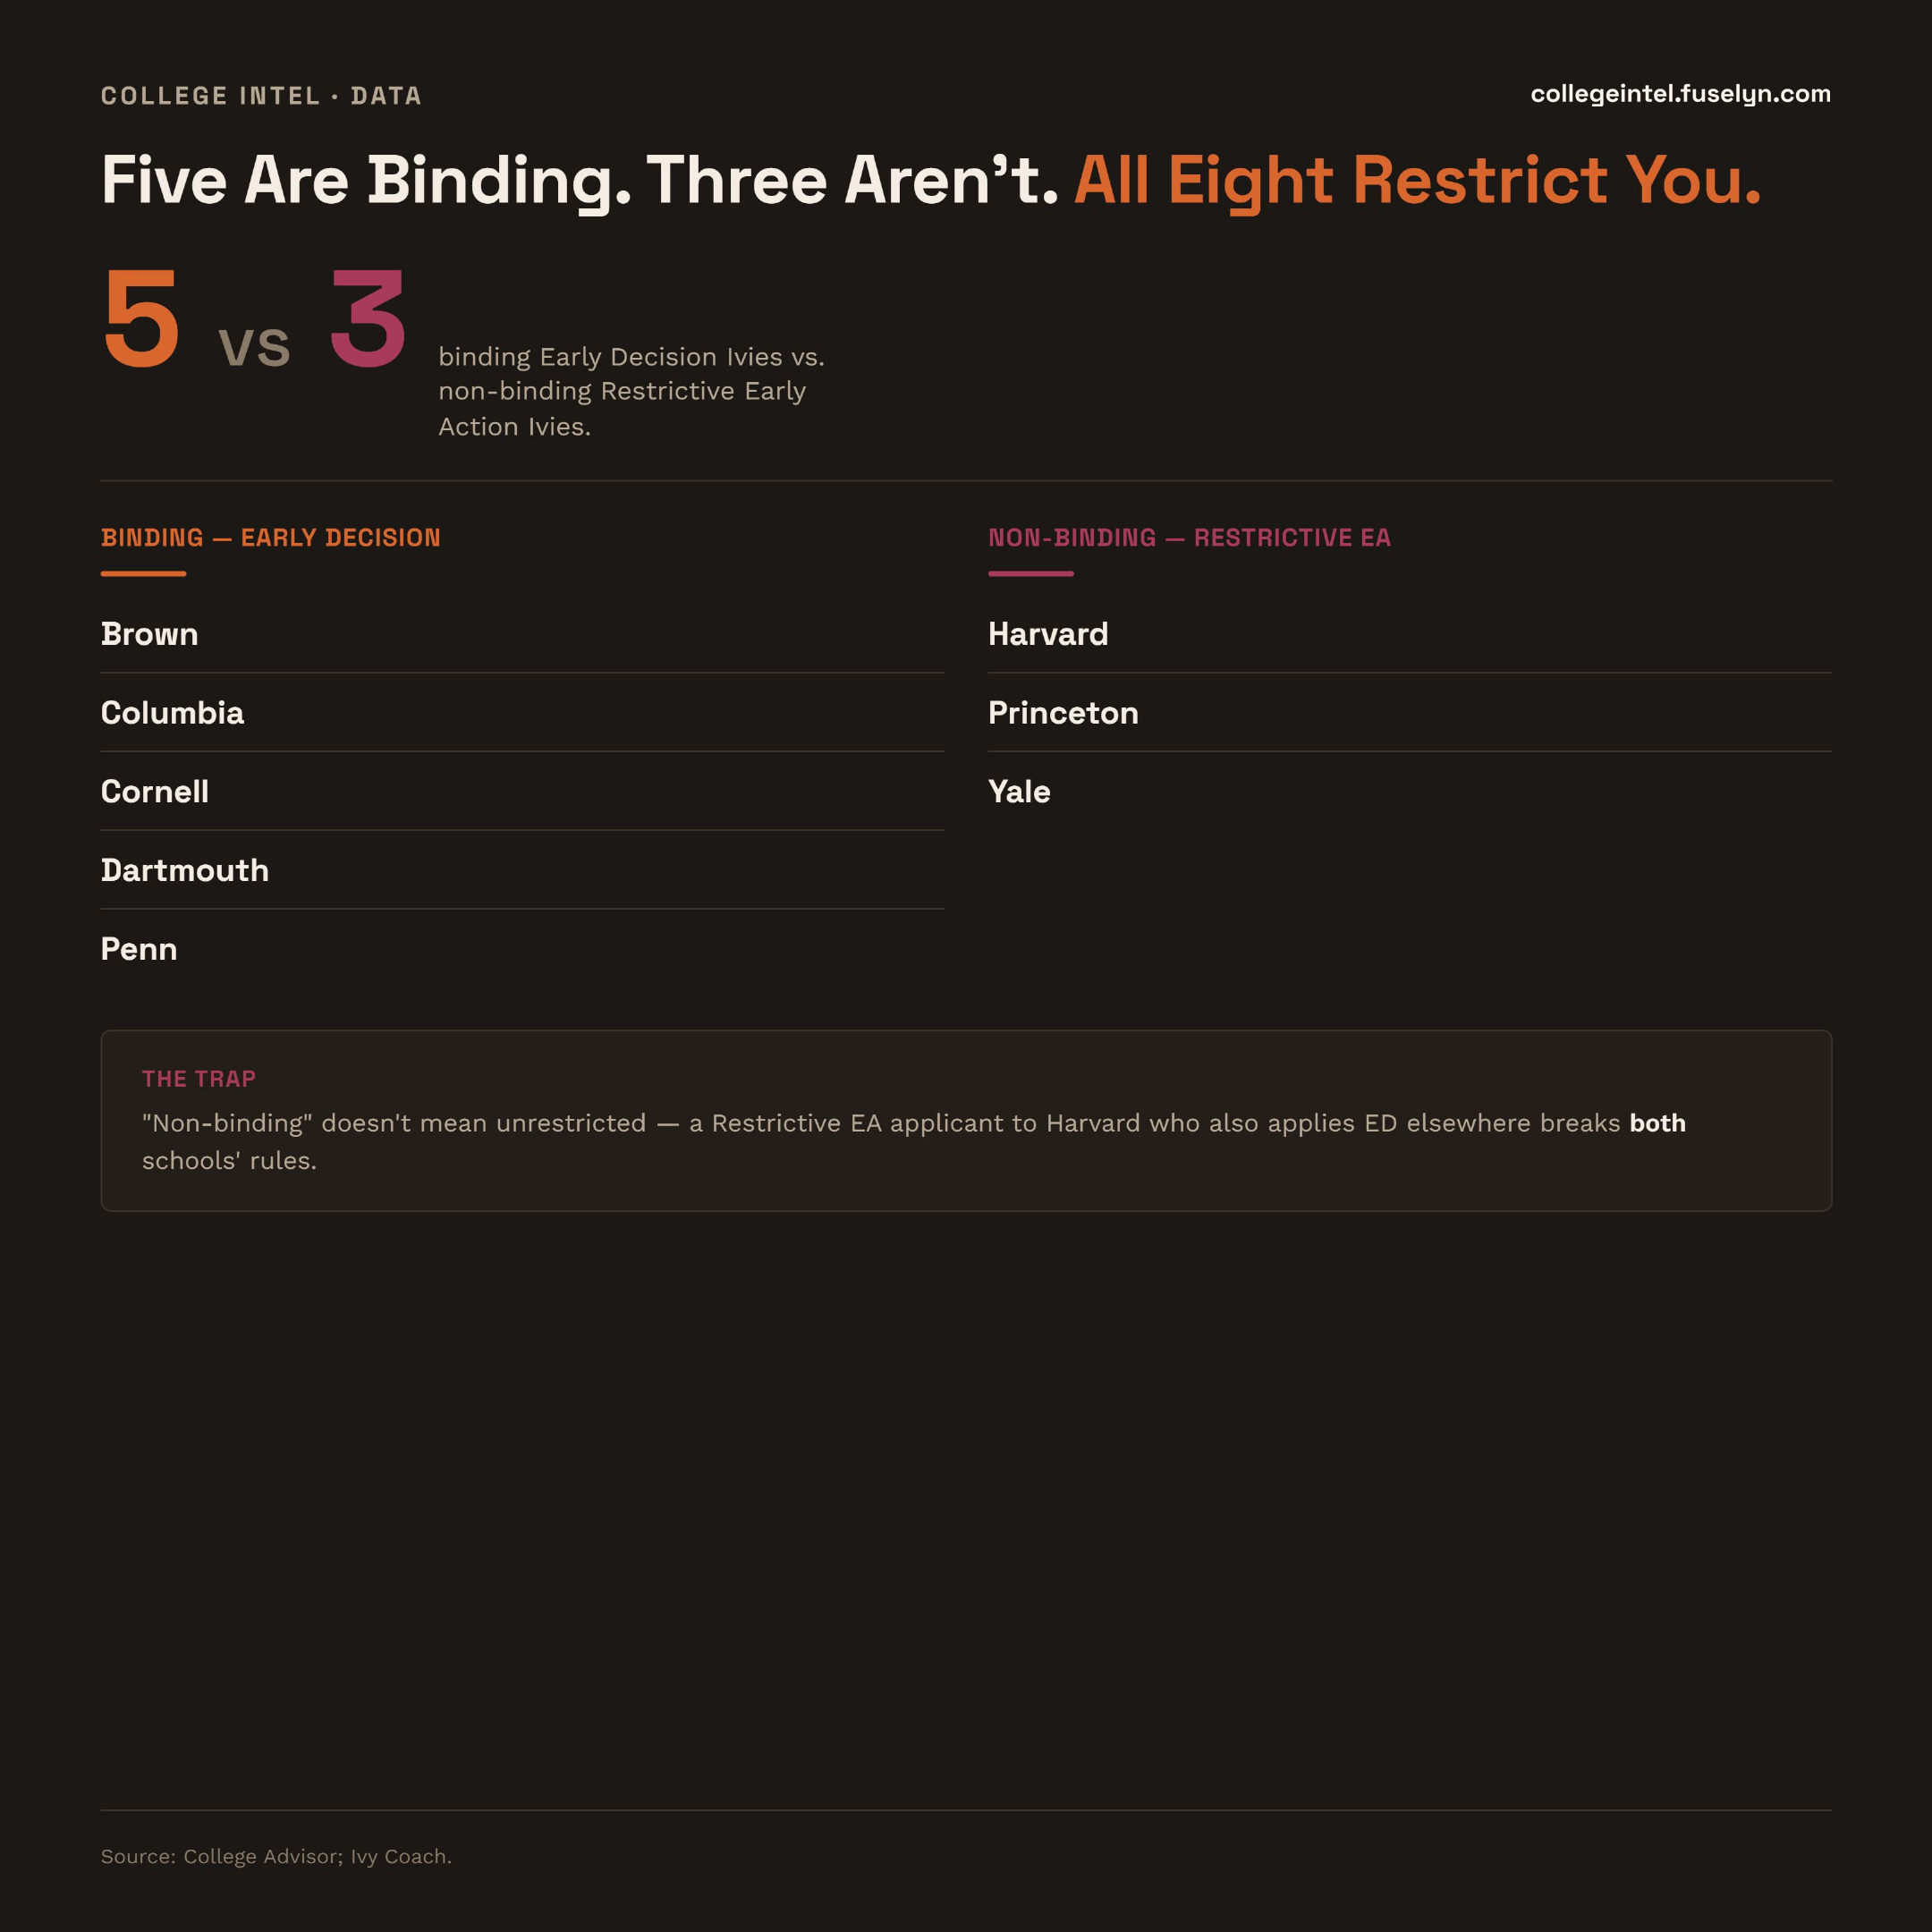
Five are binding. Three aren't. All eight restrict you.

Five Ivies use binding Early Decision. Three -- Harvard, Princeton, and Yale -- use a non-binding Restrictive Early Action that still stops you from applying early to any other private school. See which type each Ivy uses, and the trap that catches applicants who miss the distinction, in our full article. Read the full article.
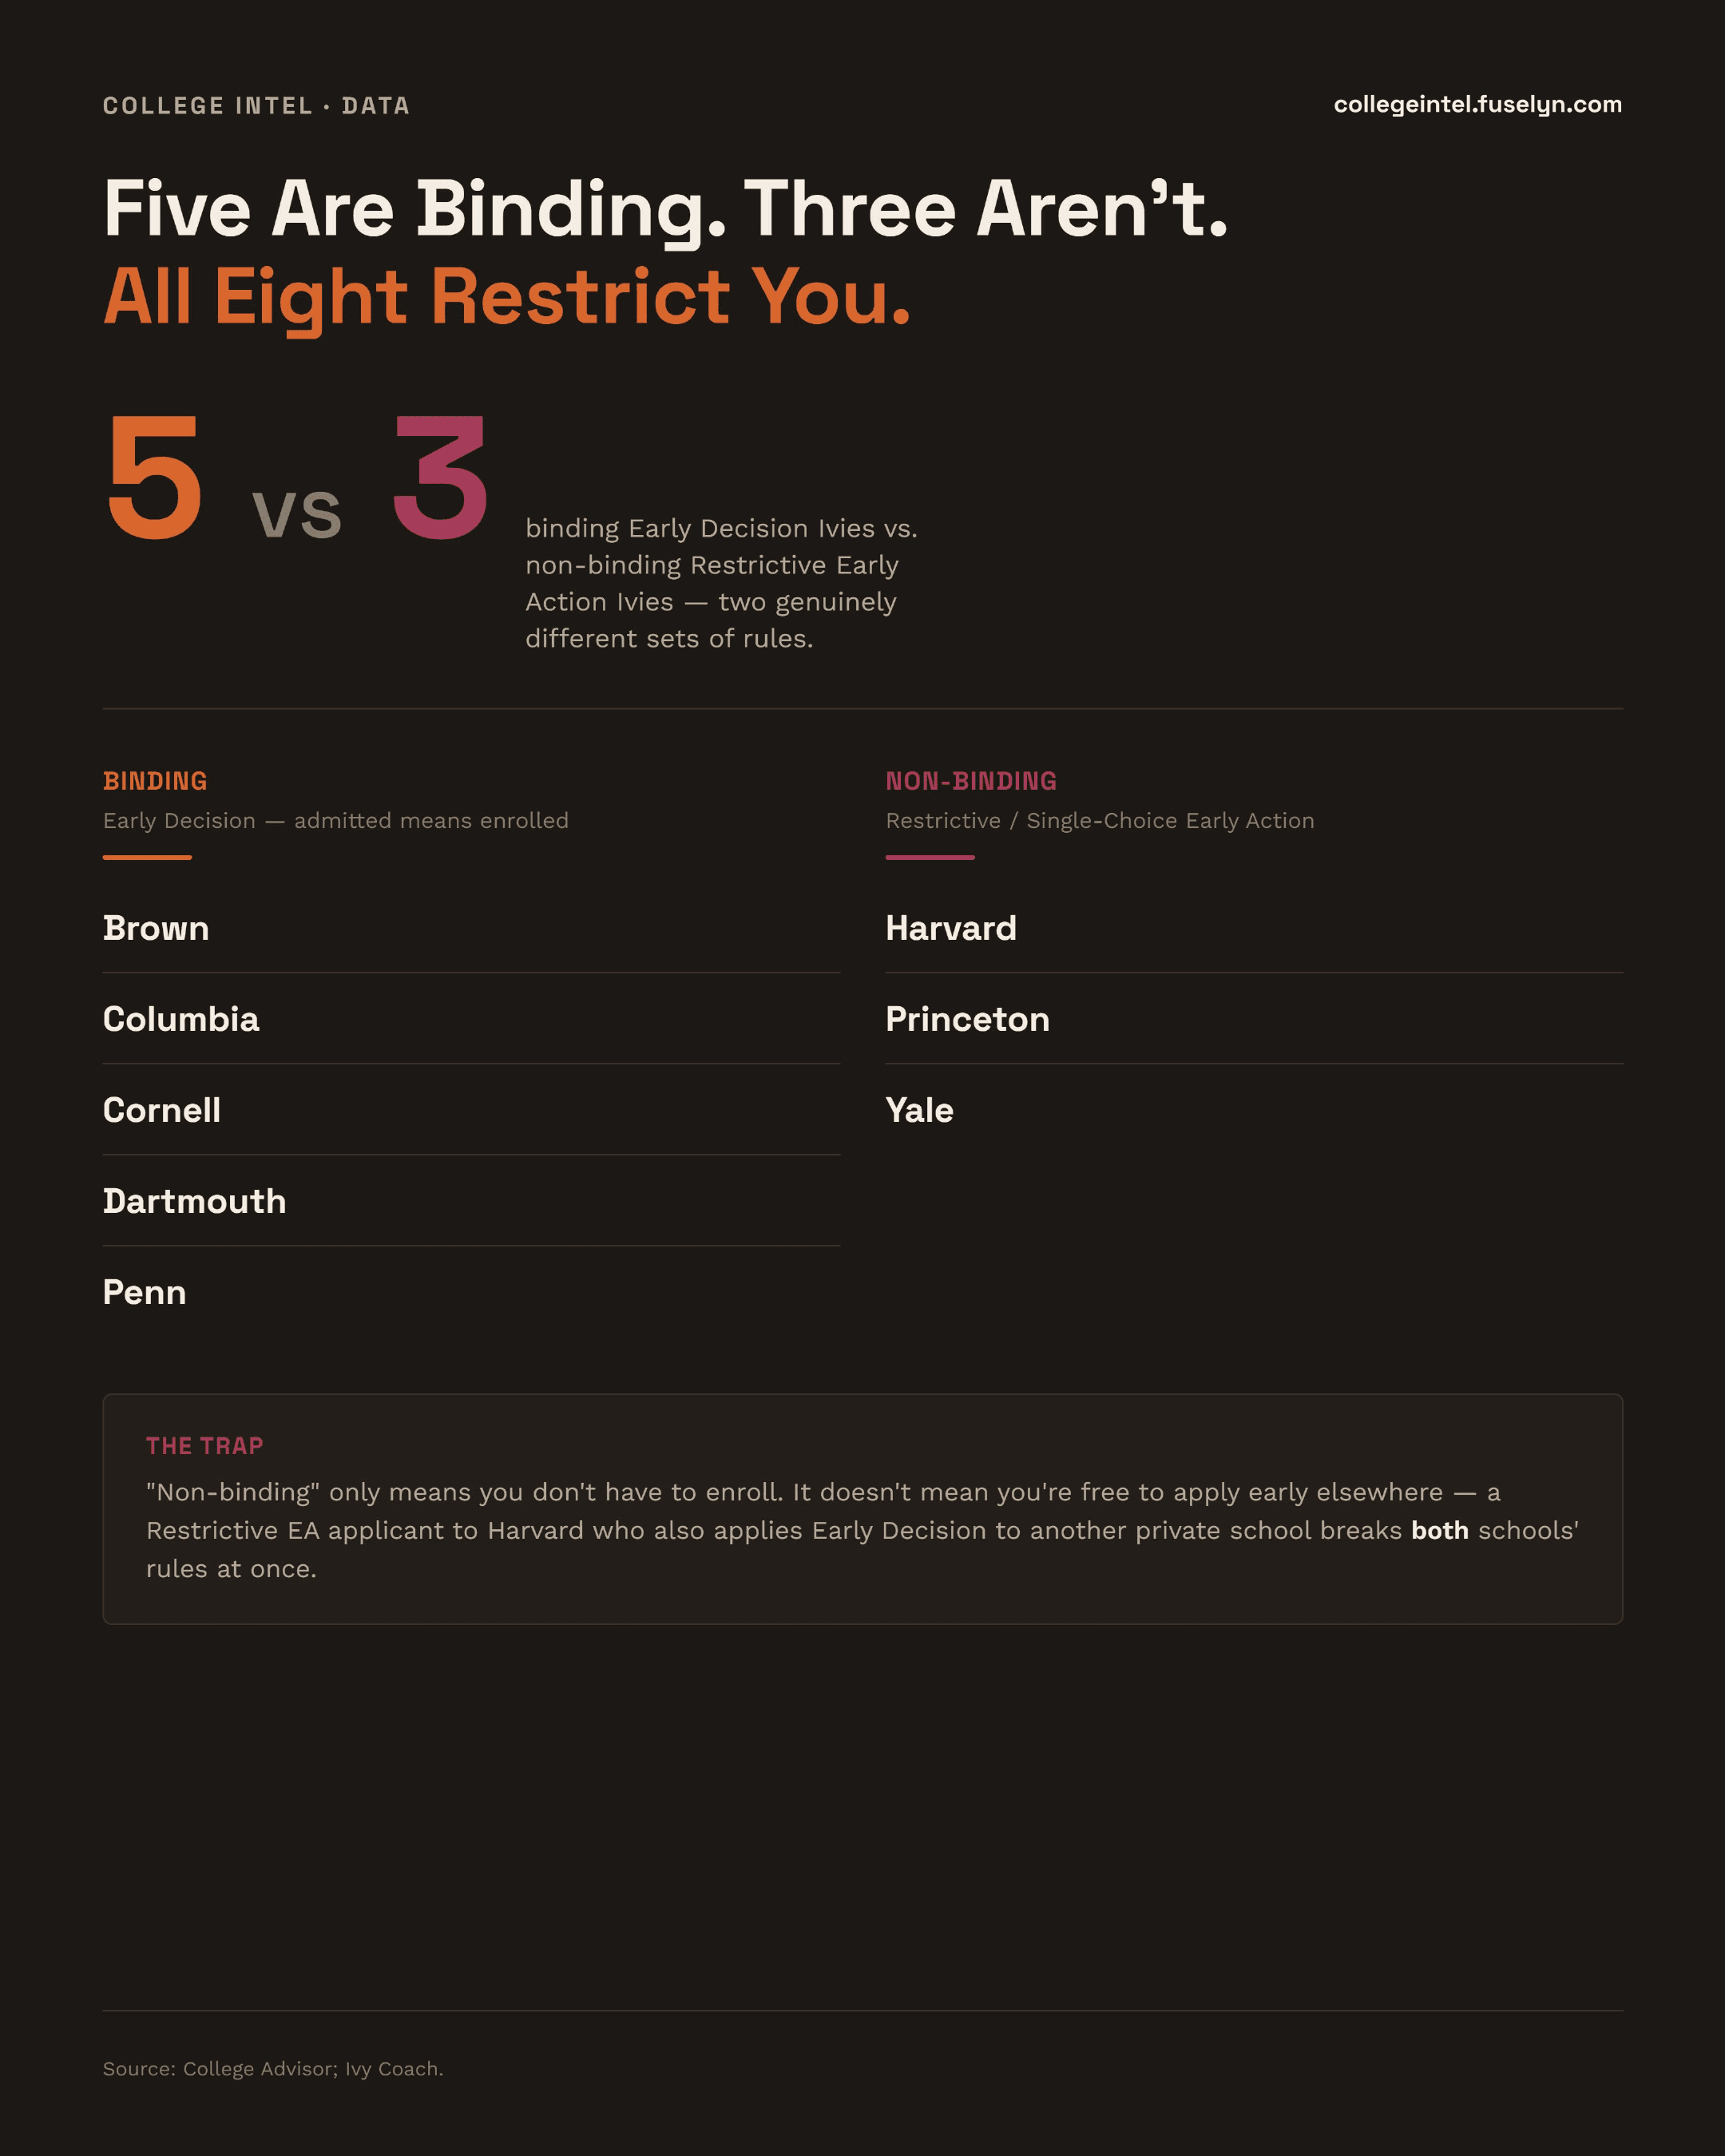
Infographic titled 'Five Are Binding. Three Aren't. All Eight Restrict You.' 5 vs 3: binding Early Decision Ivies vs. non-binding Restrictive Early Action Ivies. Binding Early Decision: Brown, Columbia, Cornell, Dartmouth, Penn. Non-binding Restrictive EA: Harvard, Princeton, Yale. Callout, 'The Trap': non-binding only means you don't have to enroll -- it doesn't mean you're free to apply early elsewhere; a Restrictive EA applicant to Harvard who also applies Early Decision to another private school breaks both schools' rules.
Download printable PDFDownload for social (square)

Sources: College Advisor, Ivy Coach.

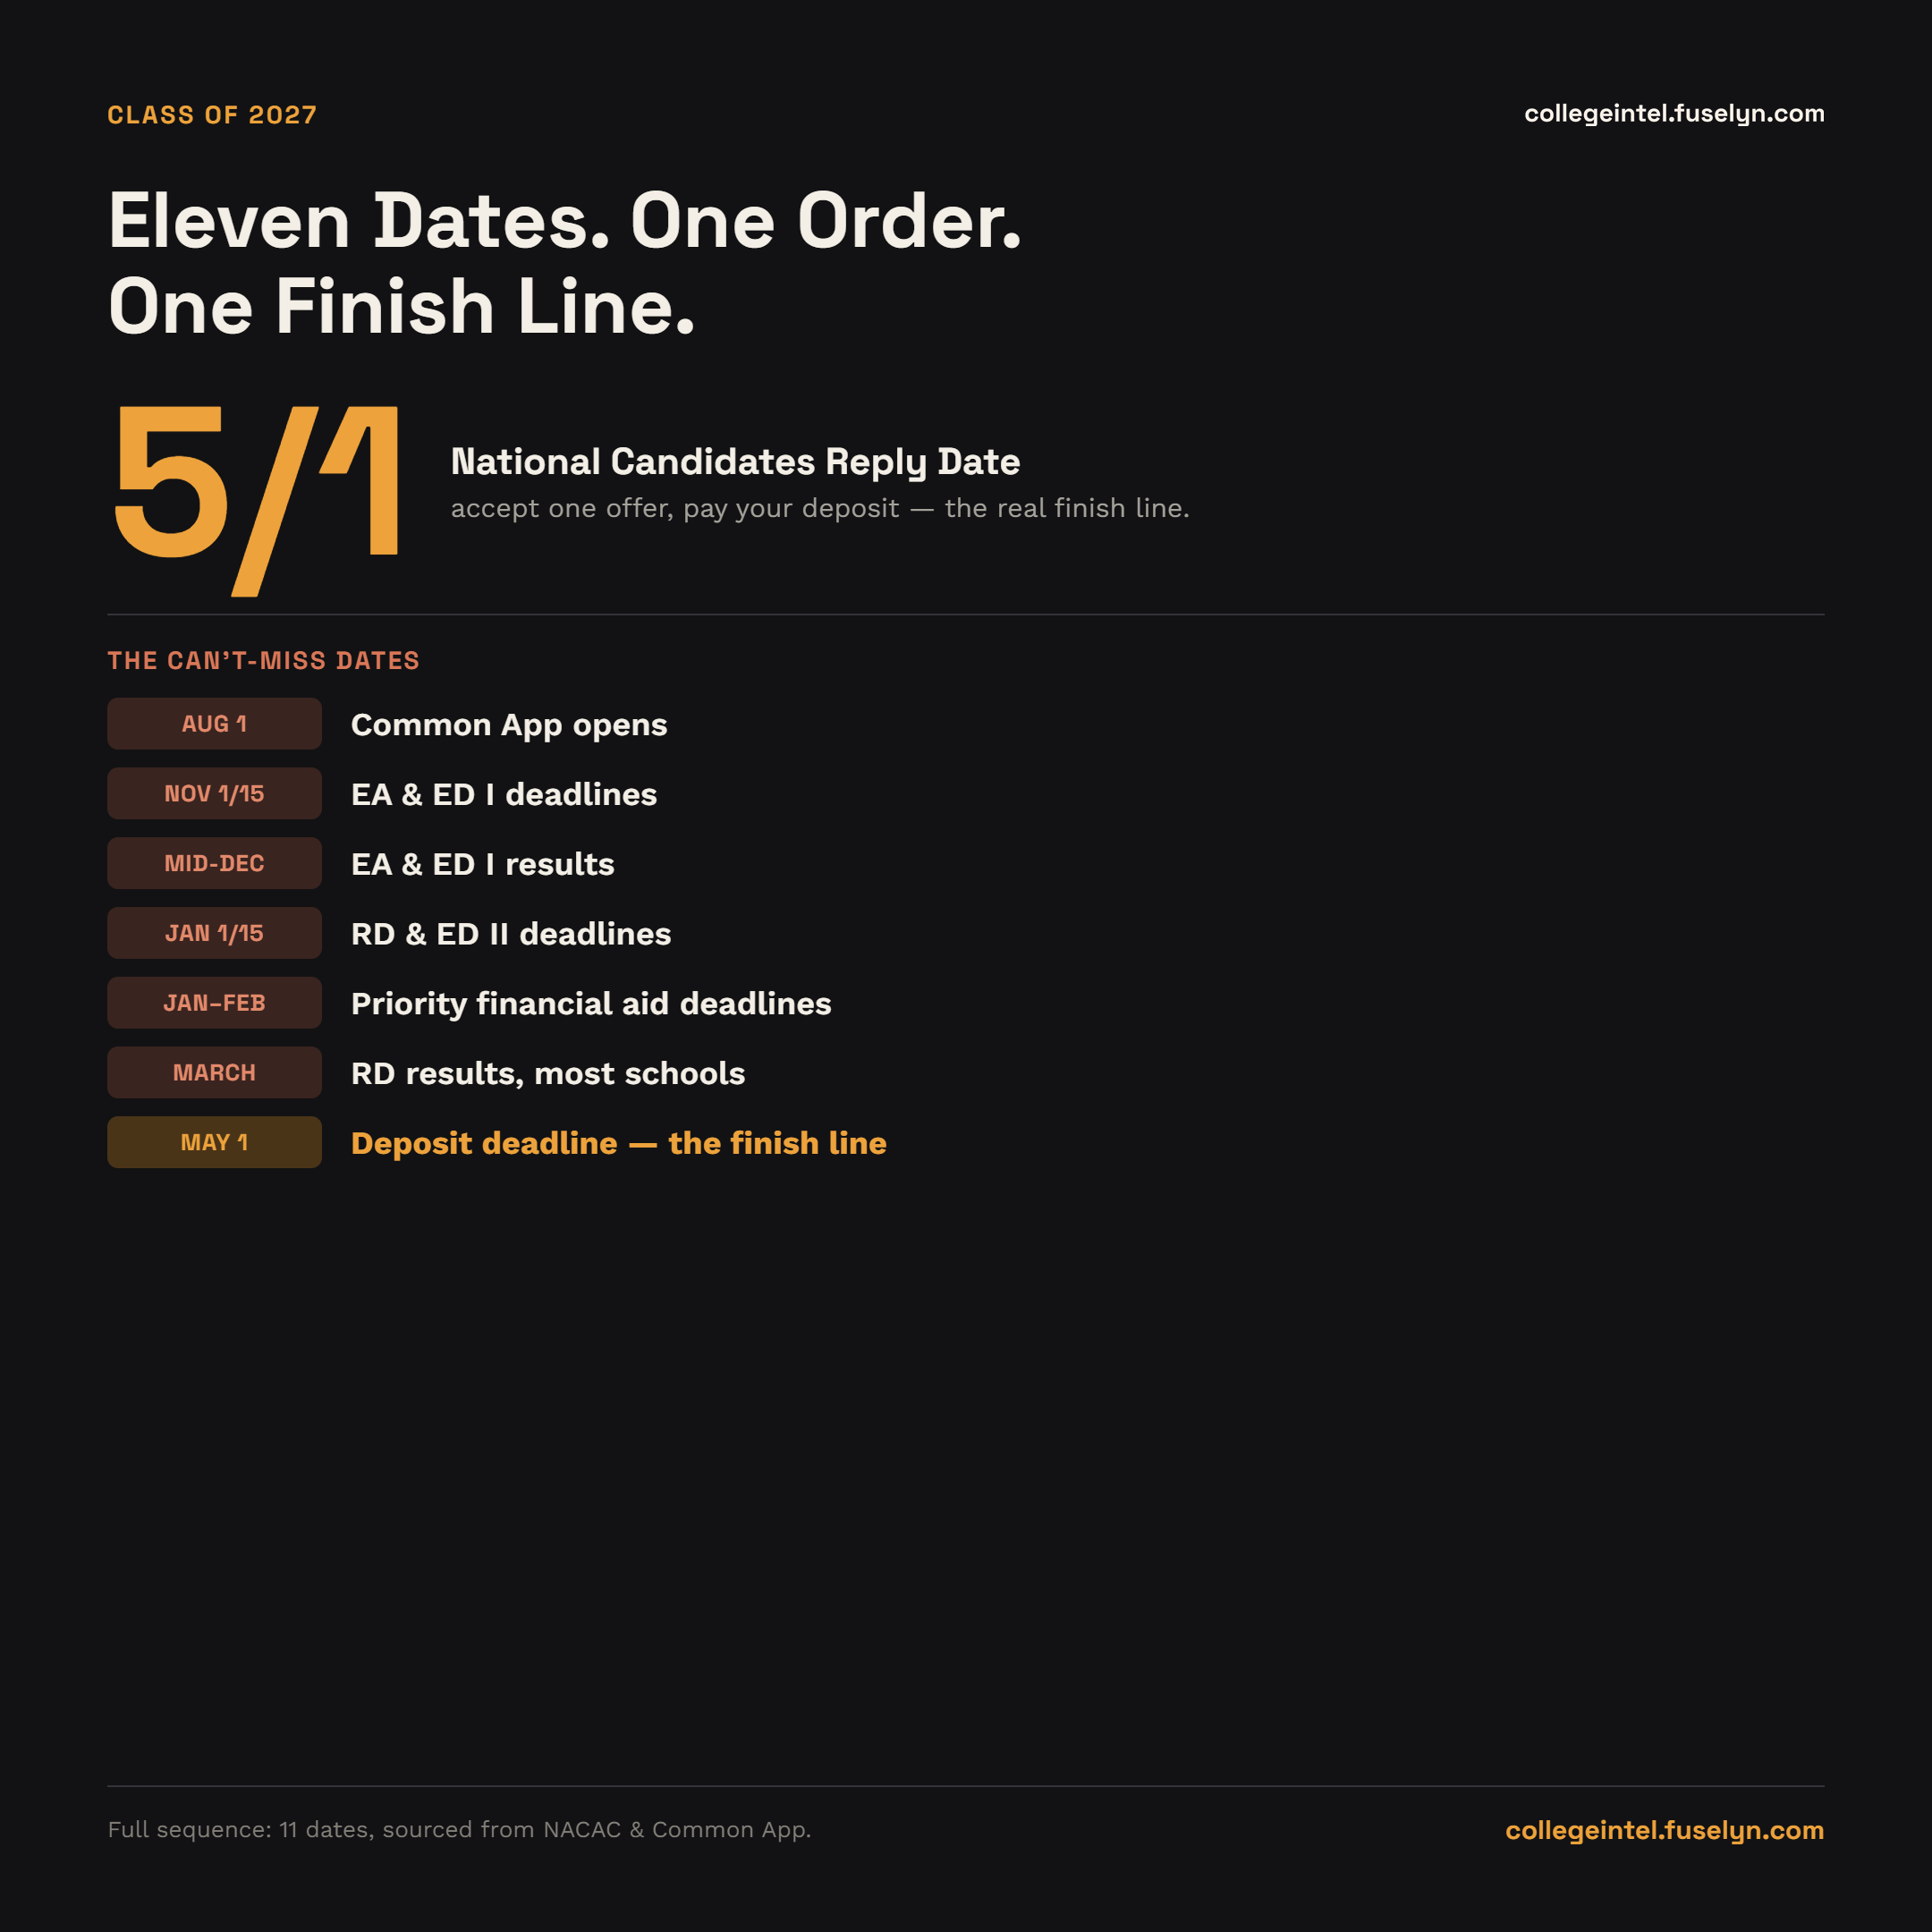
Eleven Dates. One Order. One Finish Line.

From Common App opening August 1 to the May 1 deposit deadline, senior year runs on one fixed sequence of dates -- not a random checklist. See the full order, and the one deadline that actually ends the cycle, in our full article. Read the full article.
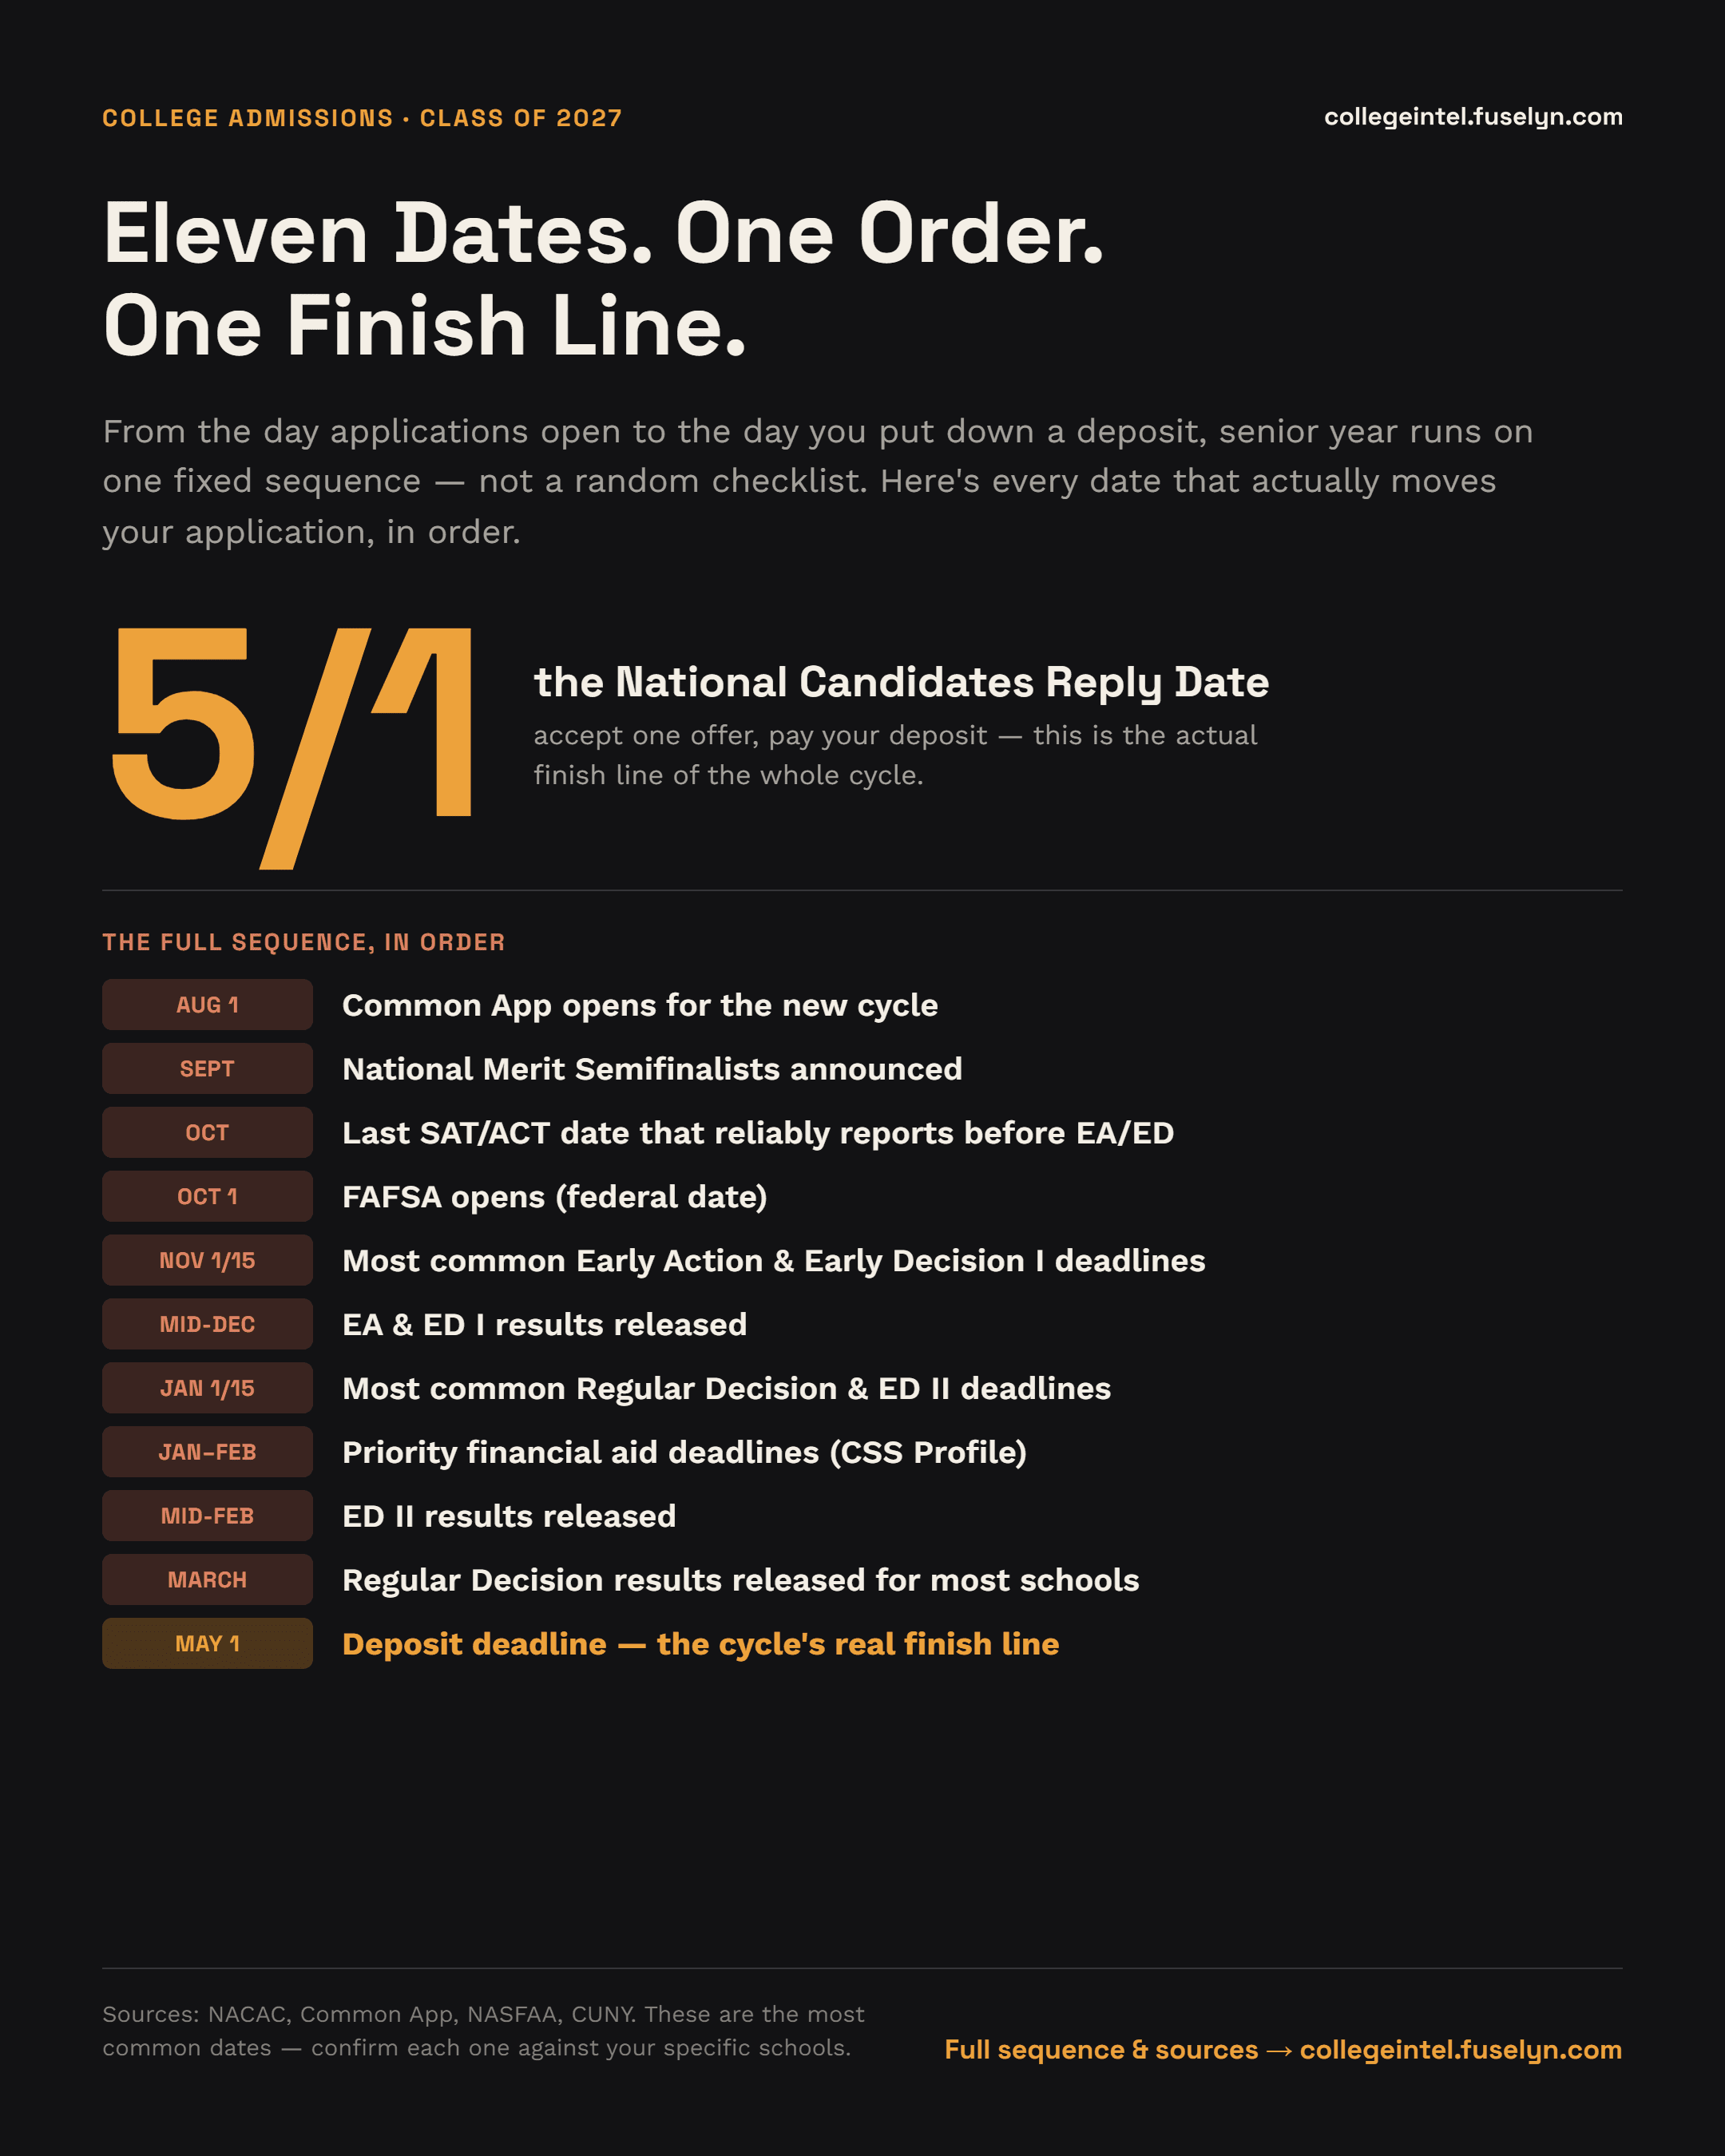
Infographic titled 'Eleven Dates. One Order. One Finish Line.' Senior-year college admissions sequence: August 1 Common App opens, September National Merit Semifinalists announced, October last SAT/ACT date reporting before EA/ED, October 1 FAFSA opens, November 1 or 15 most common EA and ED I deadlines, mid-December EA and ED I results, January 1 or 15 most common RD and ED II deadlines, January-February priority financial aid deadlines (CSS Profile), mid-February ED II results, March RD results for most schools, May 1 deposit deadline -- the National Candidates Reply Date and the cycle's real finish line.
Download printable PDFDownload for social (square)

Sources: NACAC, Common App, NASFAA, CUNY.

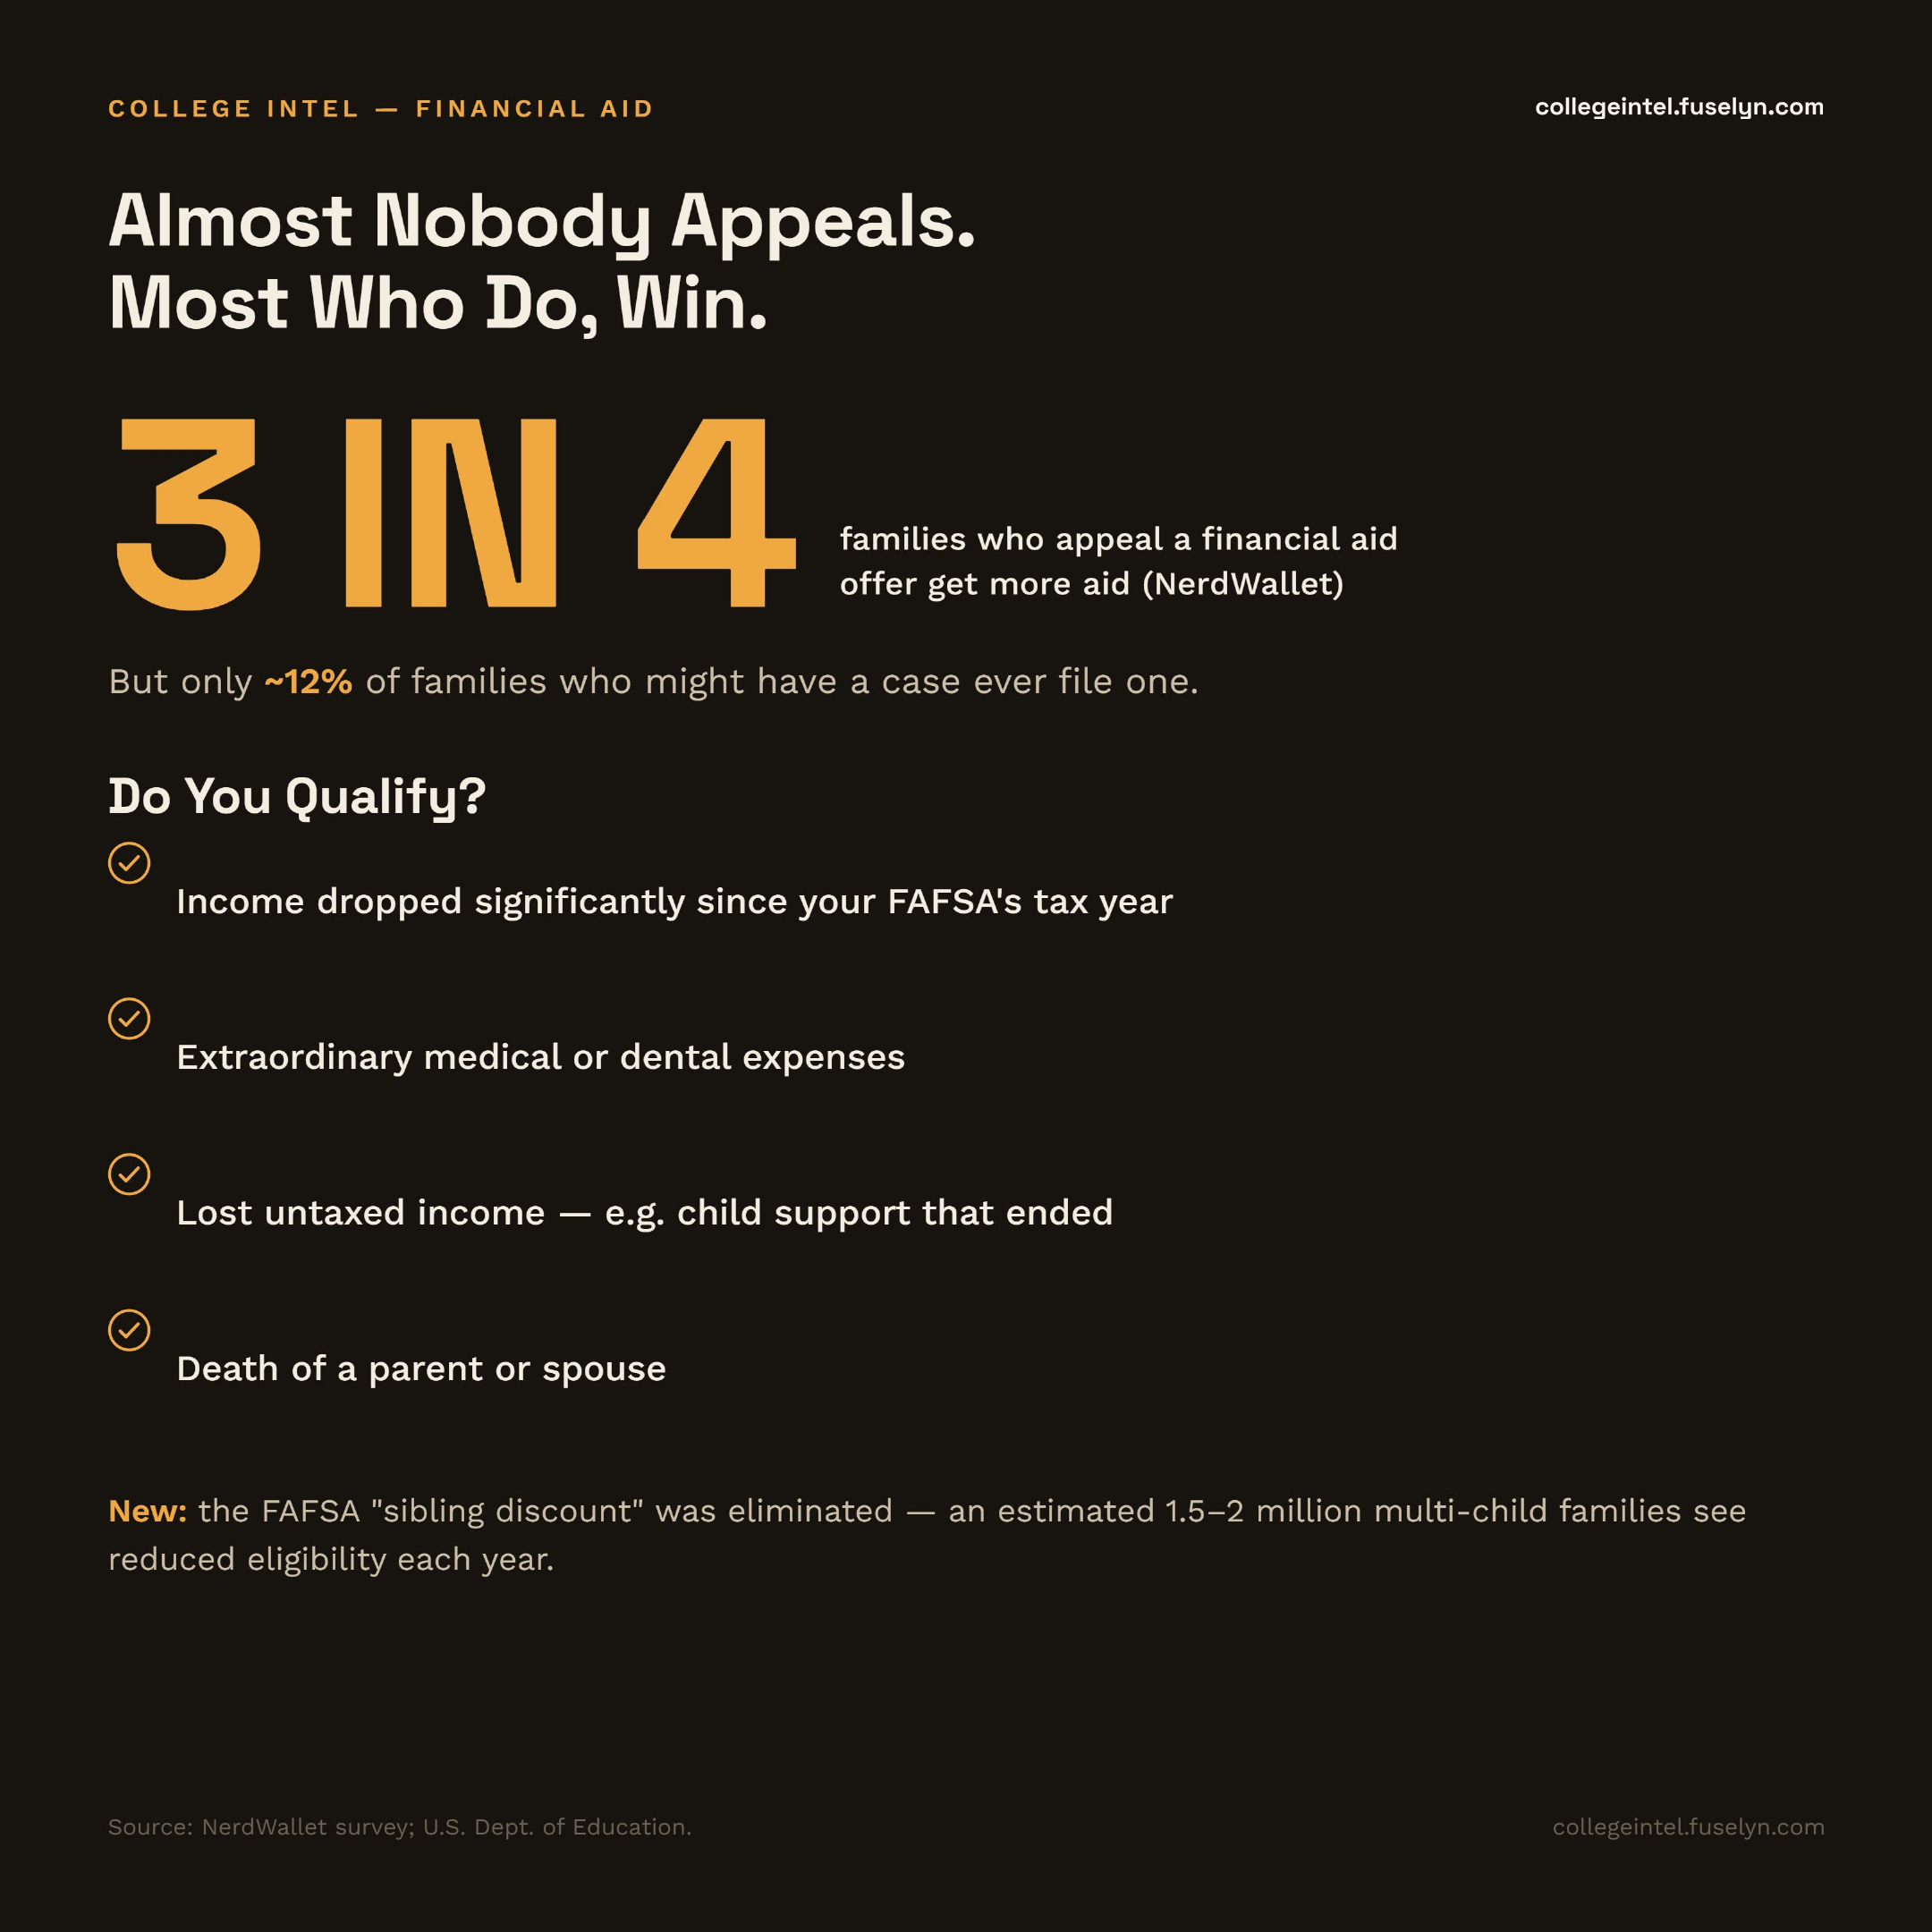
Almost nobody appeals. Most who do, win.

Only about 12% of families who might have a case for a financial-aid appeal ever file one -- but roughly 3 in 4 who do get more aid. See who actually qualifies, and a new reason many families have a case this cycle, in our full article. Read the full article.
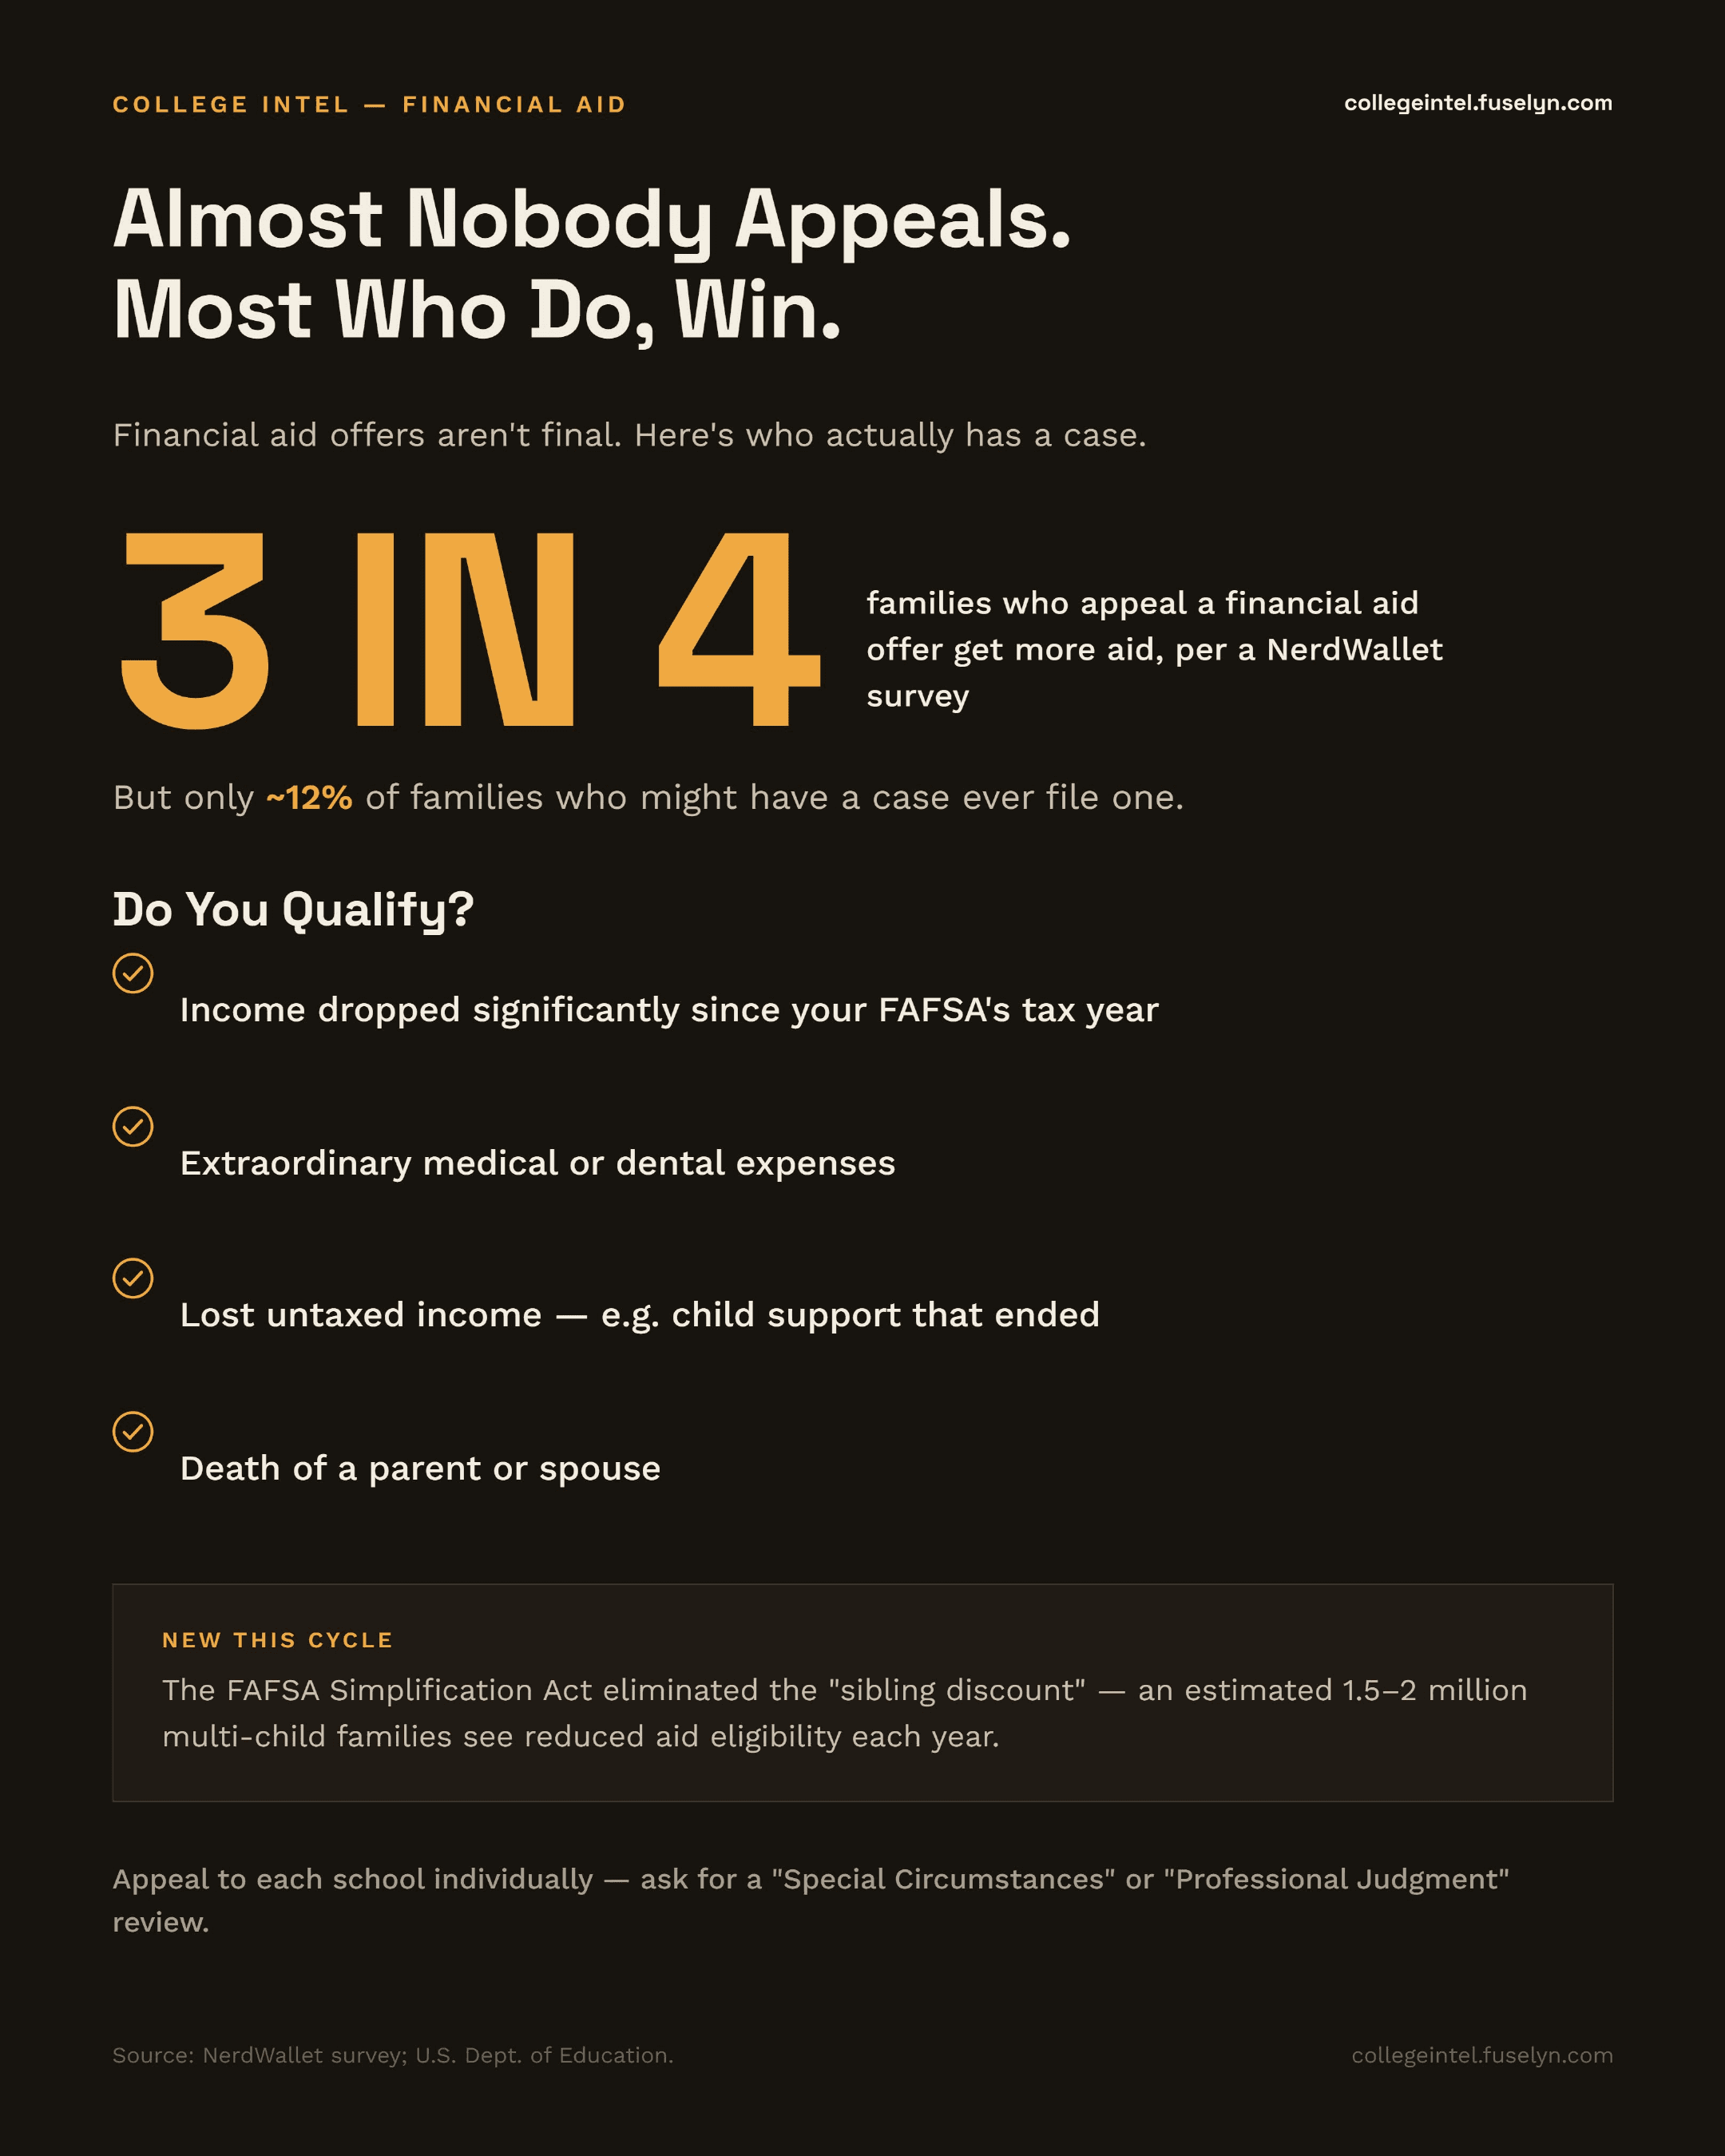
Infographic titled 'Almost Nobody Appeals. Most Who Do, Win.' 3 in 4 families who appeal a financial aid offer get more aid, per a NerdWallet survey -- but only about 12% of families who might have a case ever file one. Do you qualify: income dropped since your FAFSA's tax year, extraordinary medical or dental expenses, lost untaxed income such as child support that ended, or death of a parent or spouse. New this cycle: the FAFSA Simplification Act eliminated the 'sibling discount' -- an estimated 1.5-2 million multi-child families see reduced aid eligibility each year.
Download printable PDFDownload for social (square)

Sources: NerdWallet survey; U.S. Dept. of Education.

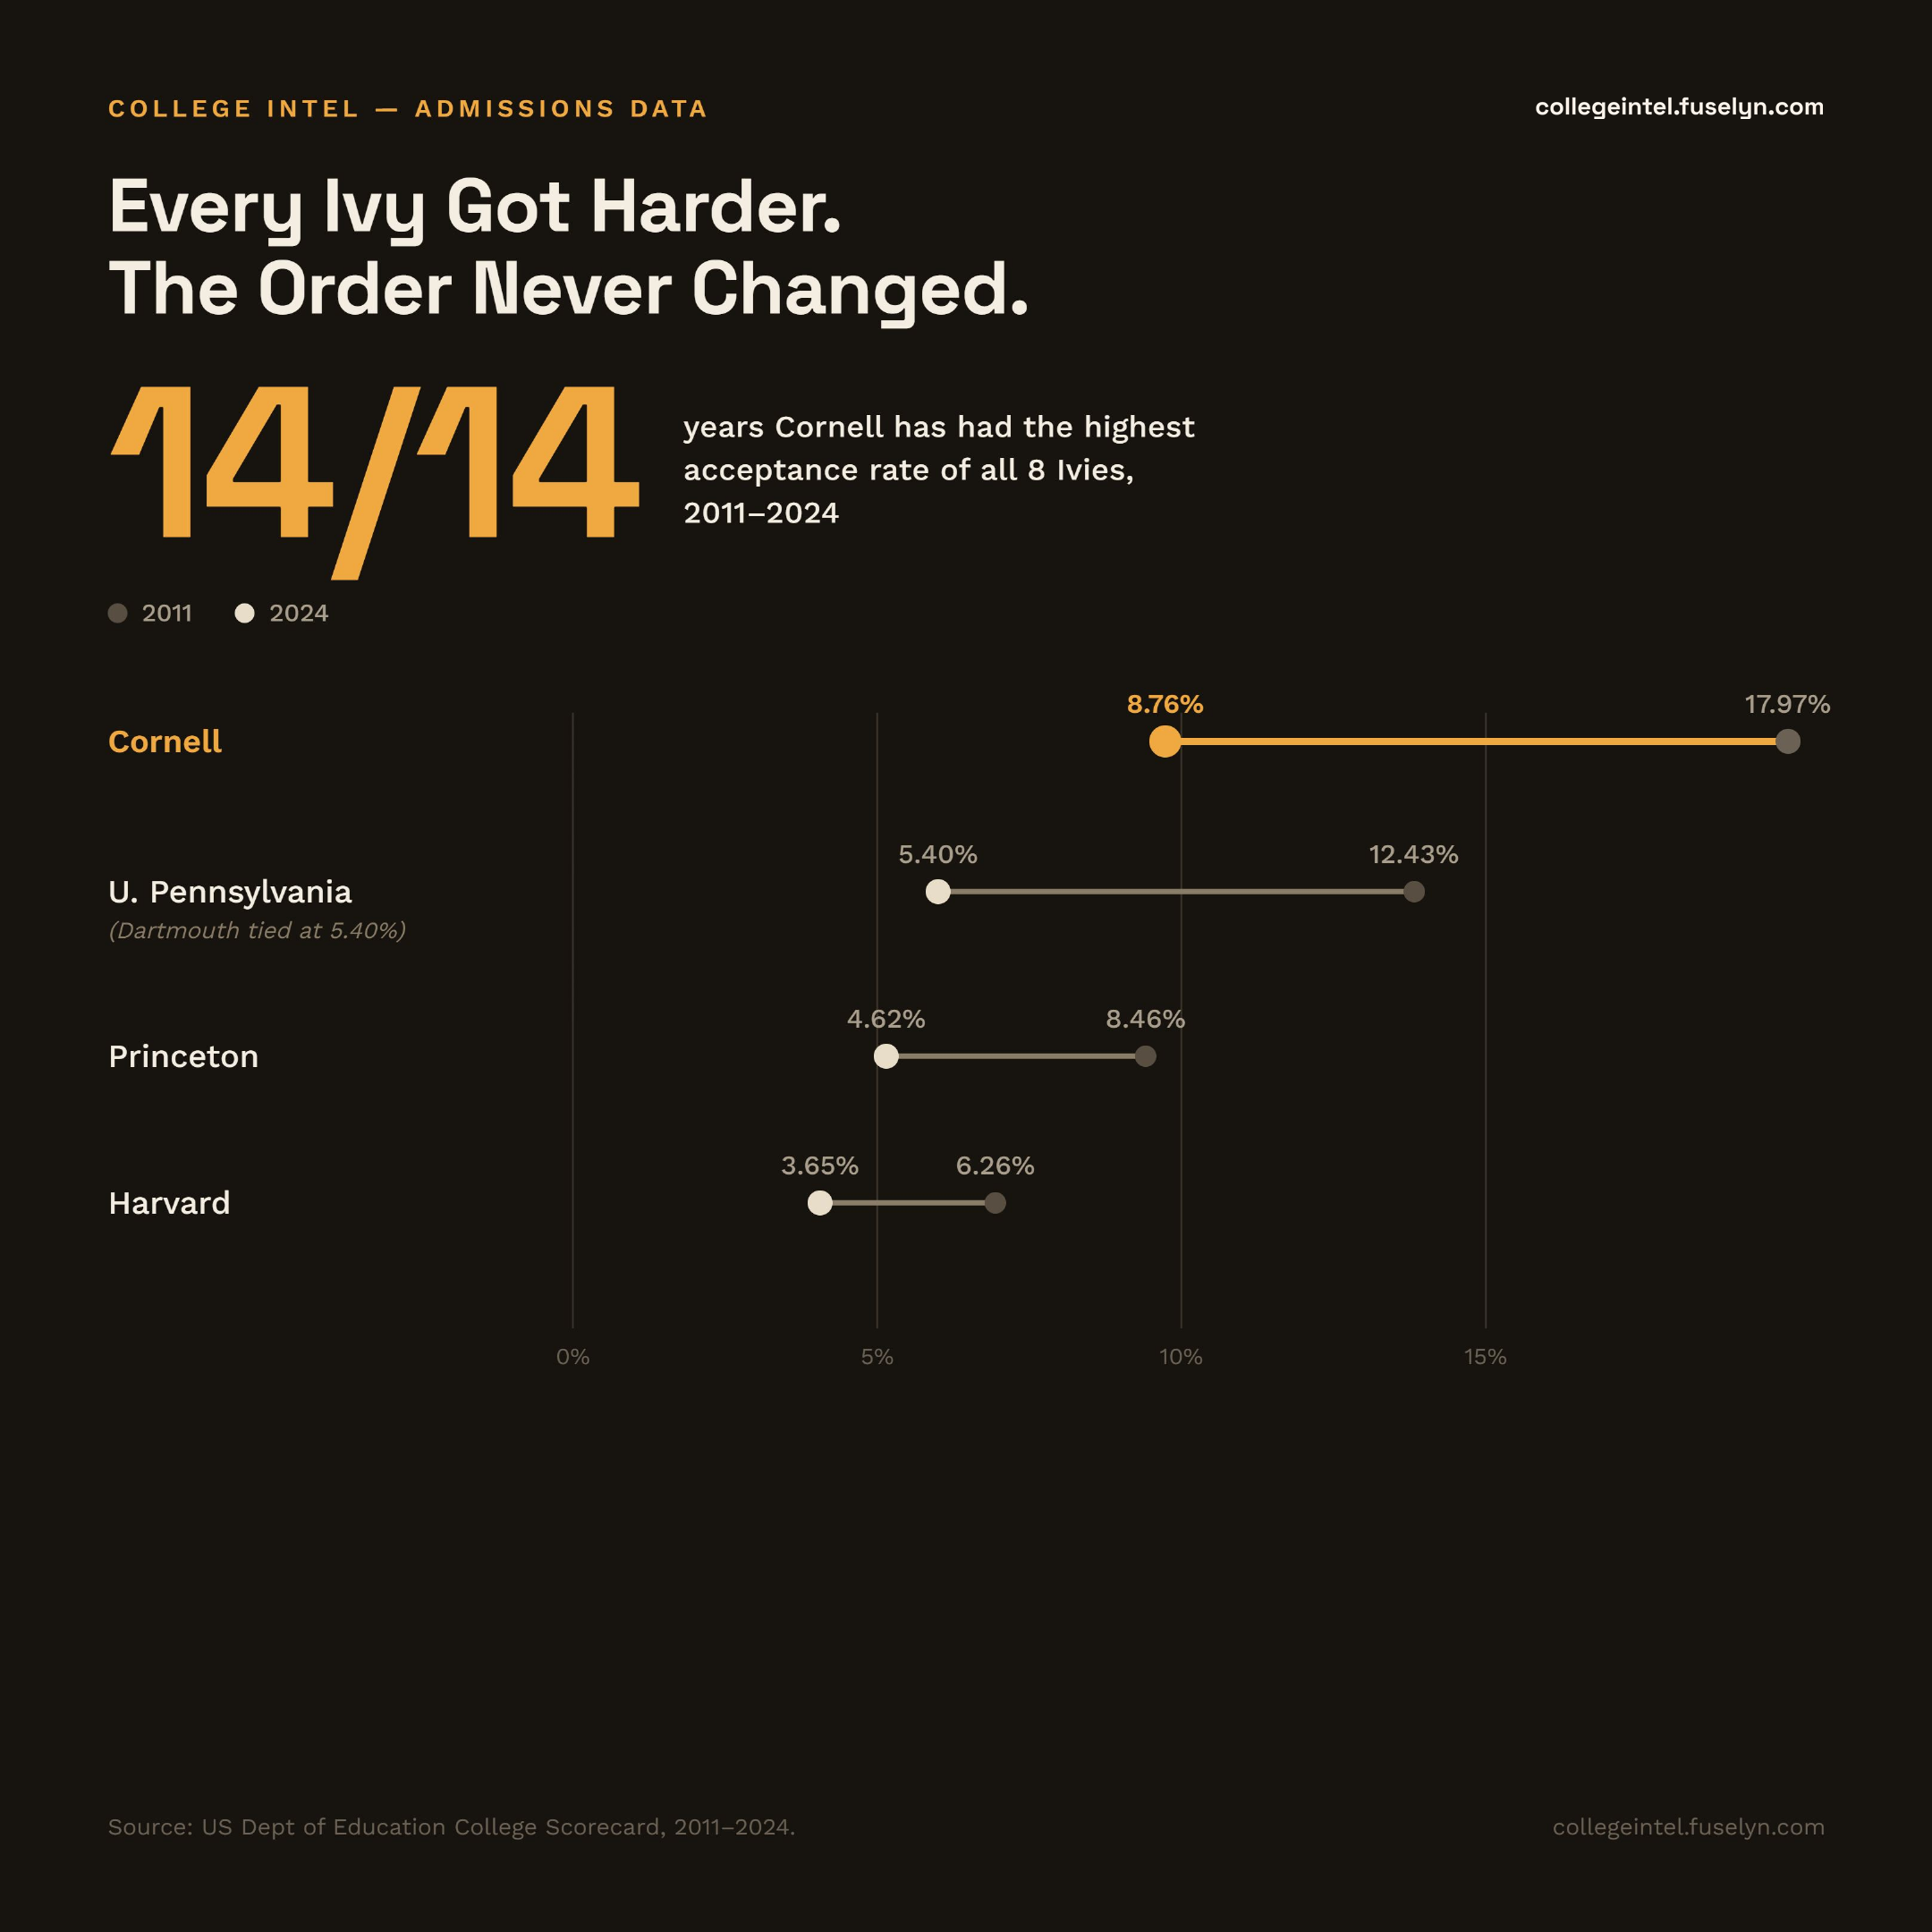
Every Ivy got harder. The order never changed.

Every Ivy League school's acceptance rate has roughly halved or more since 2011 -- but Cornell has been the highest of all 8, every single year. See the full 14-year trend, school by school, in our full article. Read the full article.
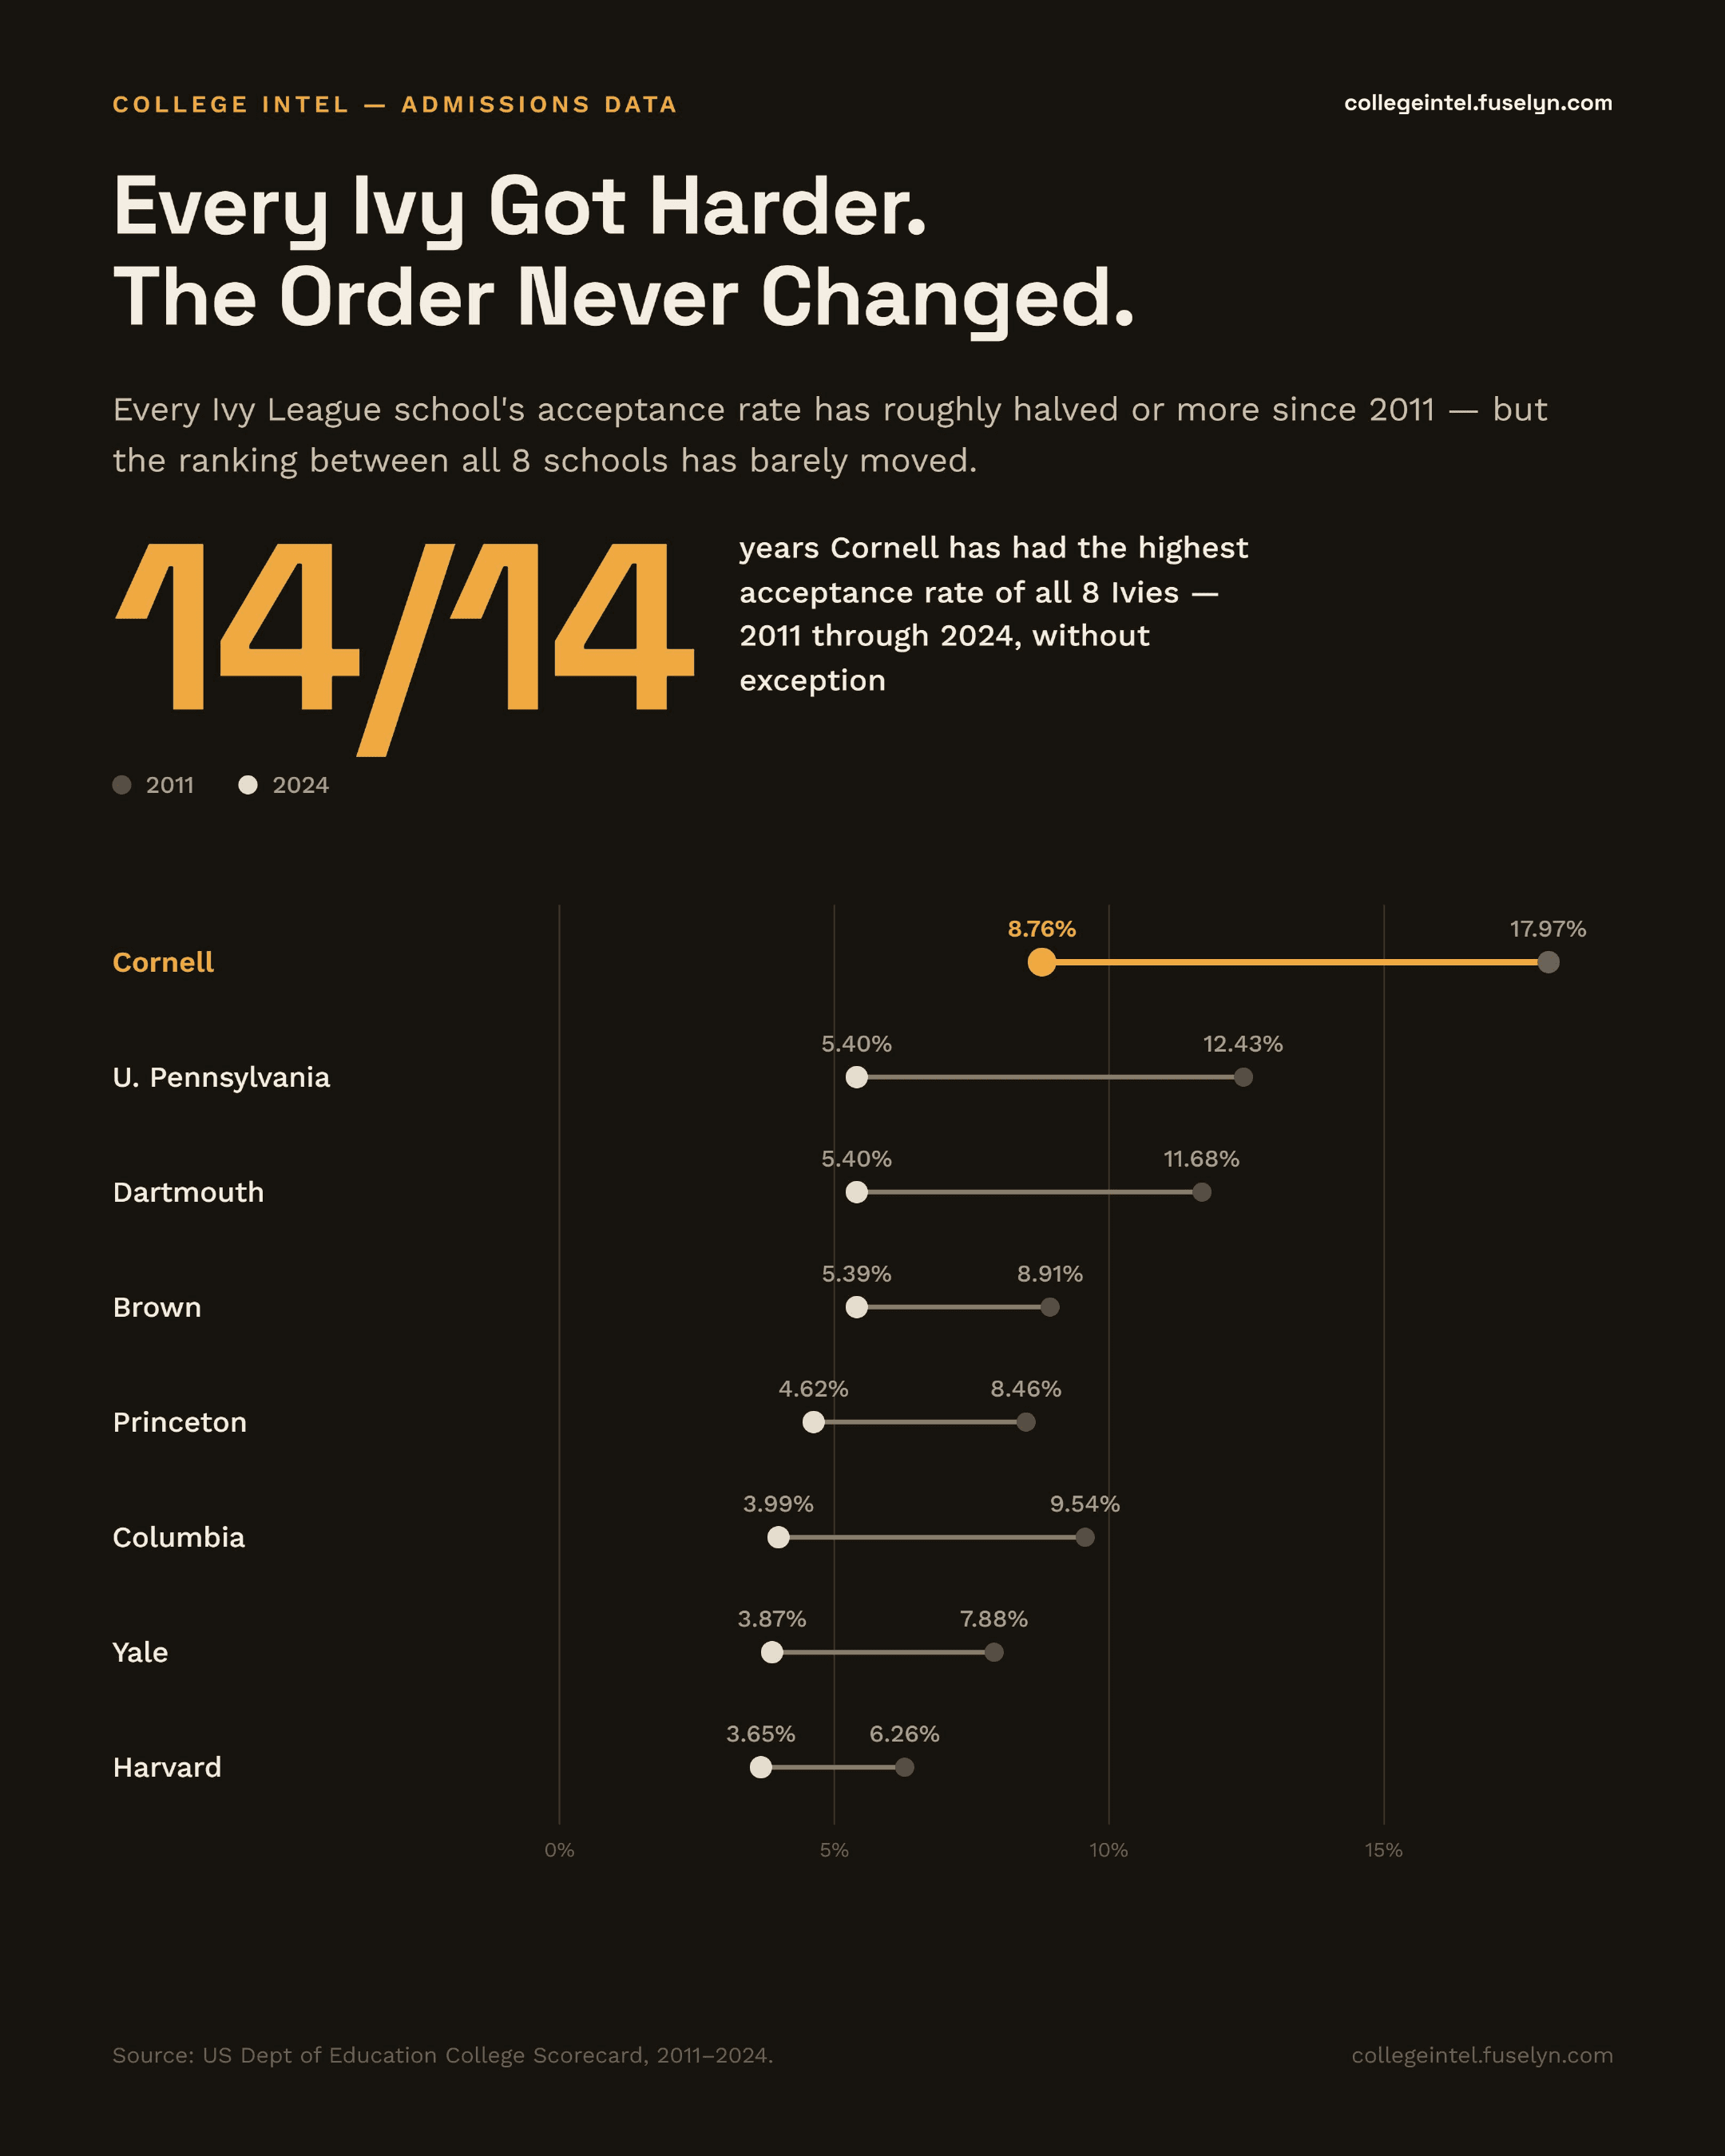
Infographic titled 'Every Ivy Got Harder. The Order Never Changed.' Cornell has had the highest acceptance rate of all 8 Ivies every year from 2011 to 2024 (14/14). 2011 to 2024 acceptance rates: Cornell 17.97% to 8.76%, University of Pennsylvania 12.43% to 5.40%, Dartmouth 11.68% to 5.40%, Brown 8.91% to 5.39%, Princeton 8.46% to 4.62%, Columbia 9.54% to 3.99%, Yale 7.88% to 3.87%, Harvard 6.26% to 3.65%.
Download printable PDFDownload for social (square)

Source: US Dept of Education College Scorecard, 2011–2024.

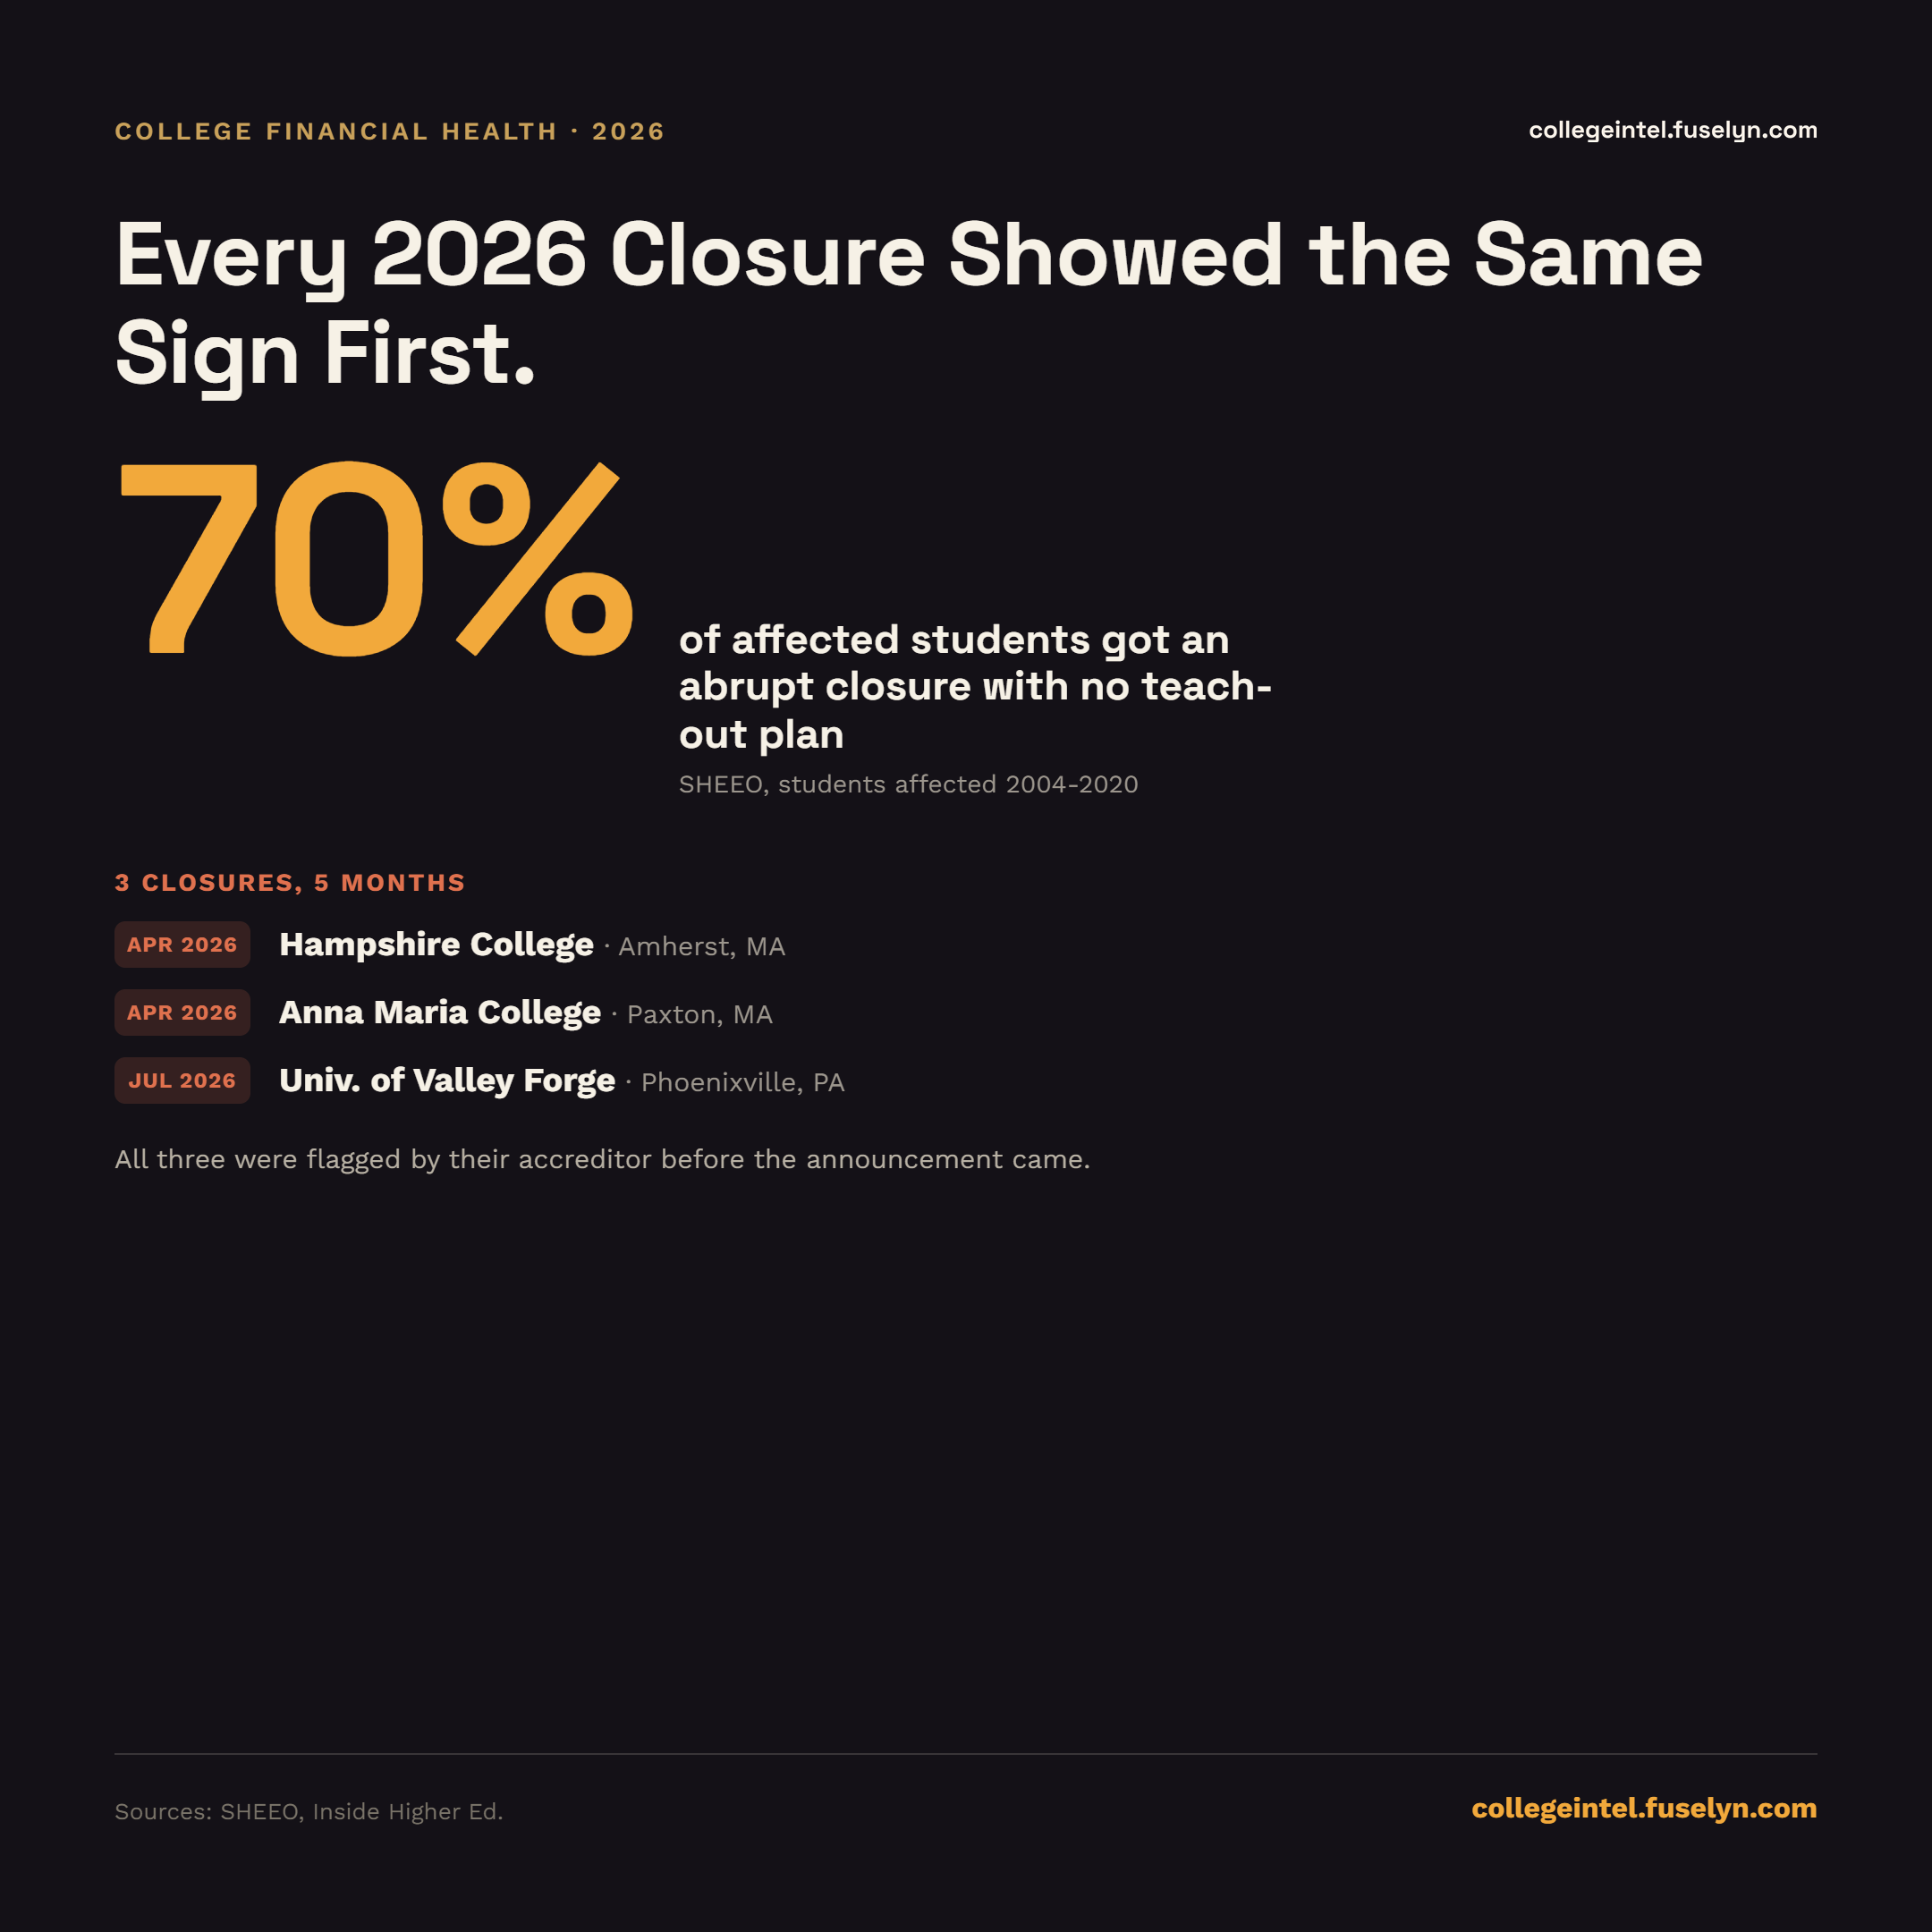
Every 2026 closure showed the same sign first

Hampshire, Anna Maria, and University of Valley Forge all announced closure within a five-month stretch of 2026 -- all three were flagged by their accreditor first. See the full picture, including what a closure means for your credits and loans, in our full article. Read the full article.
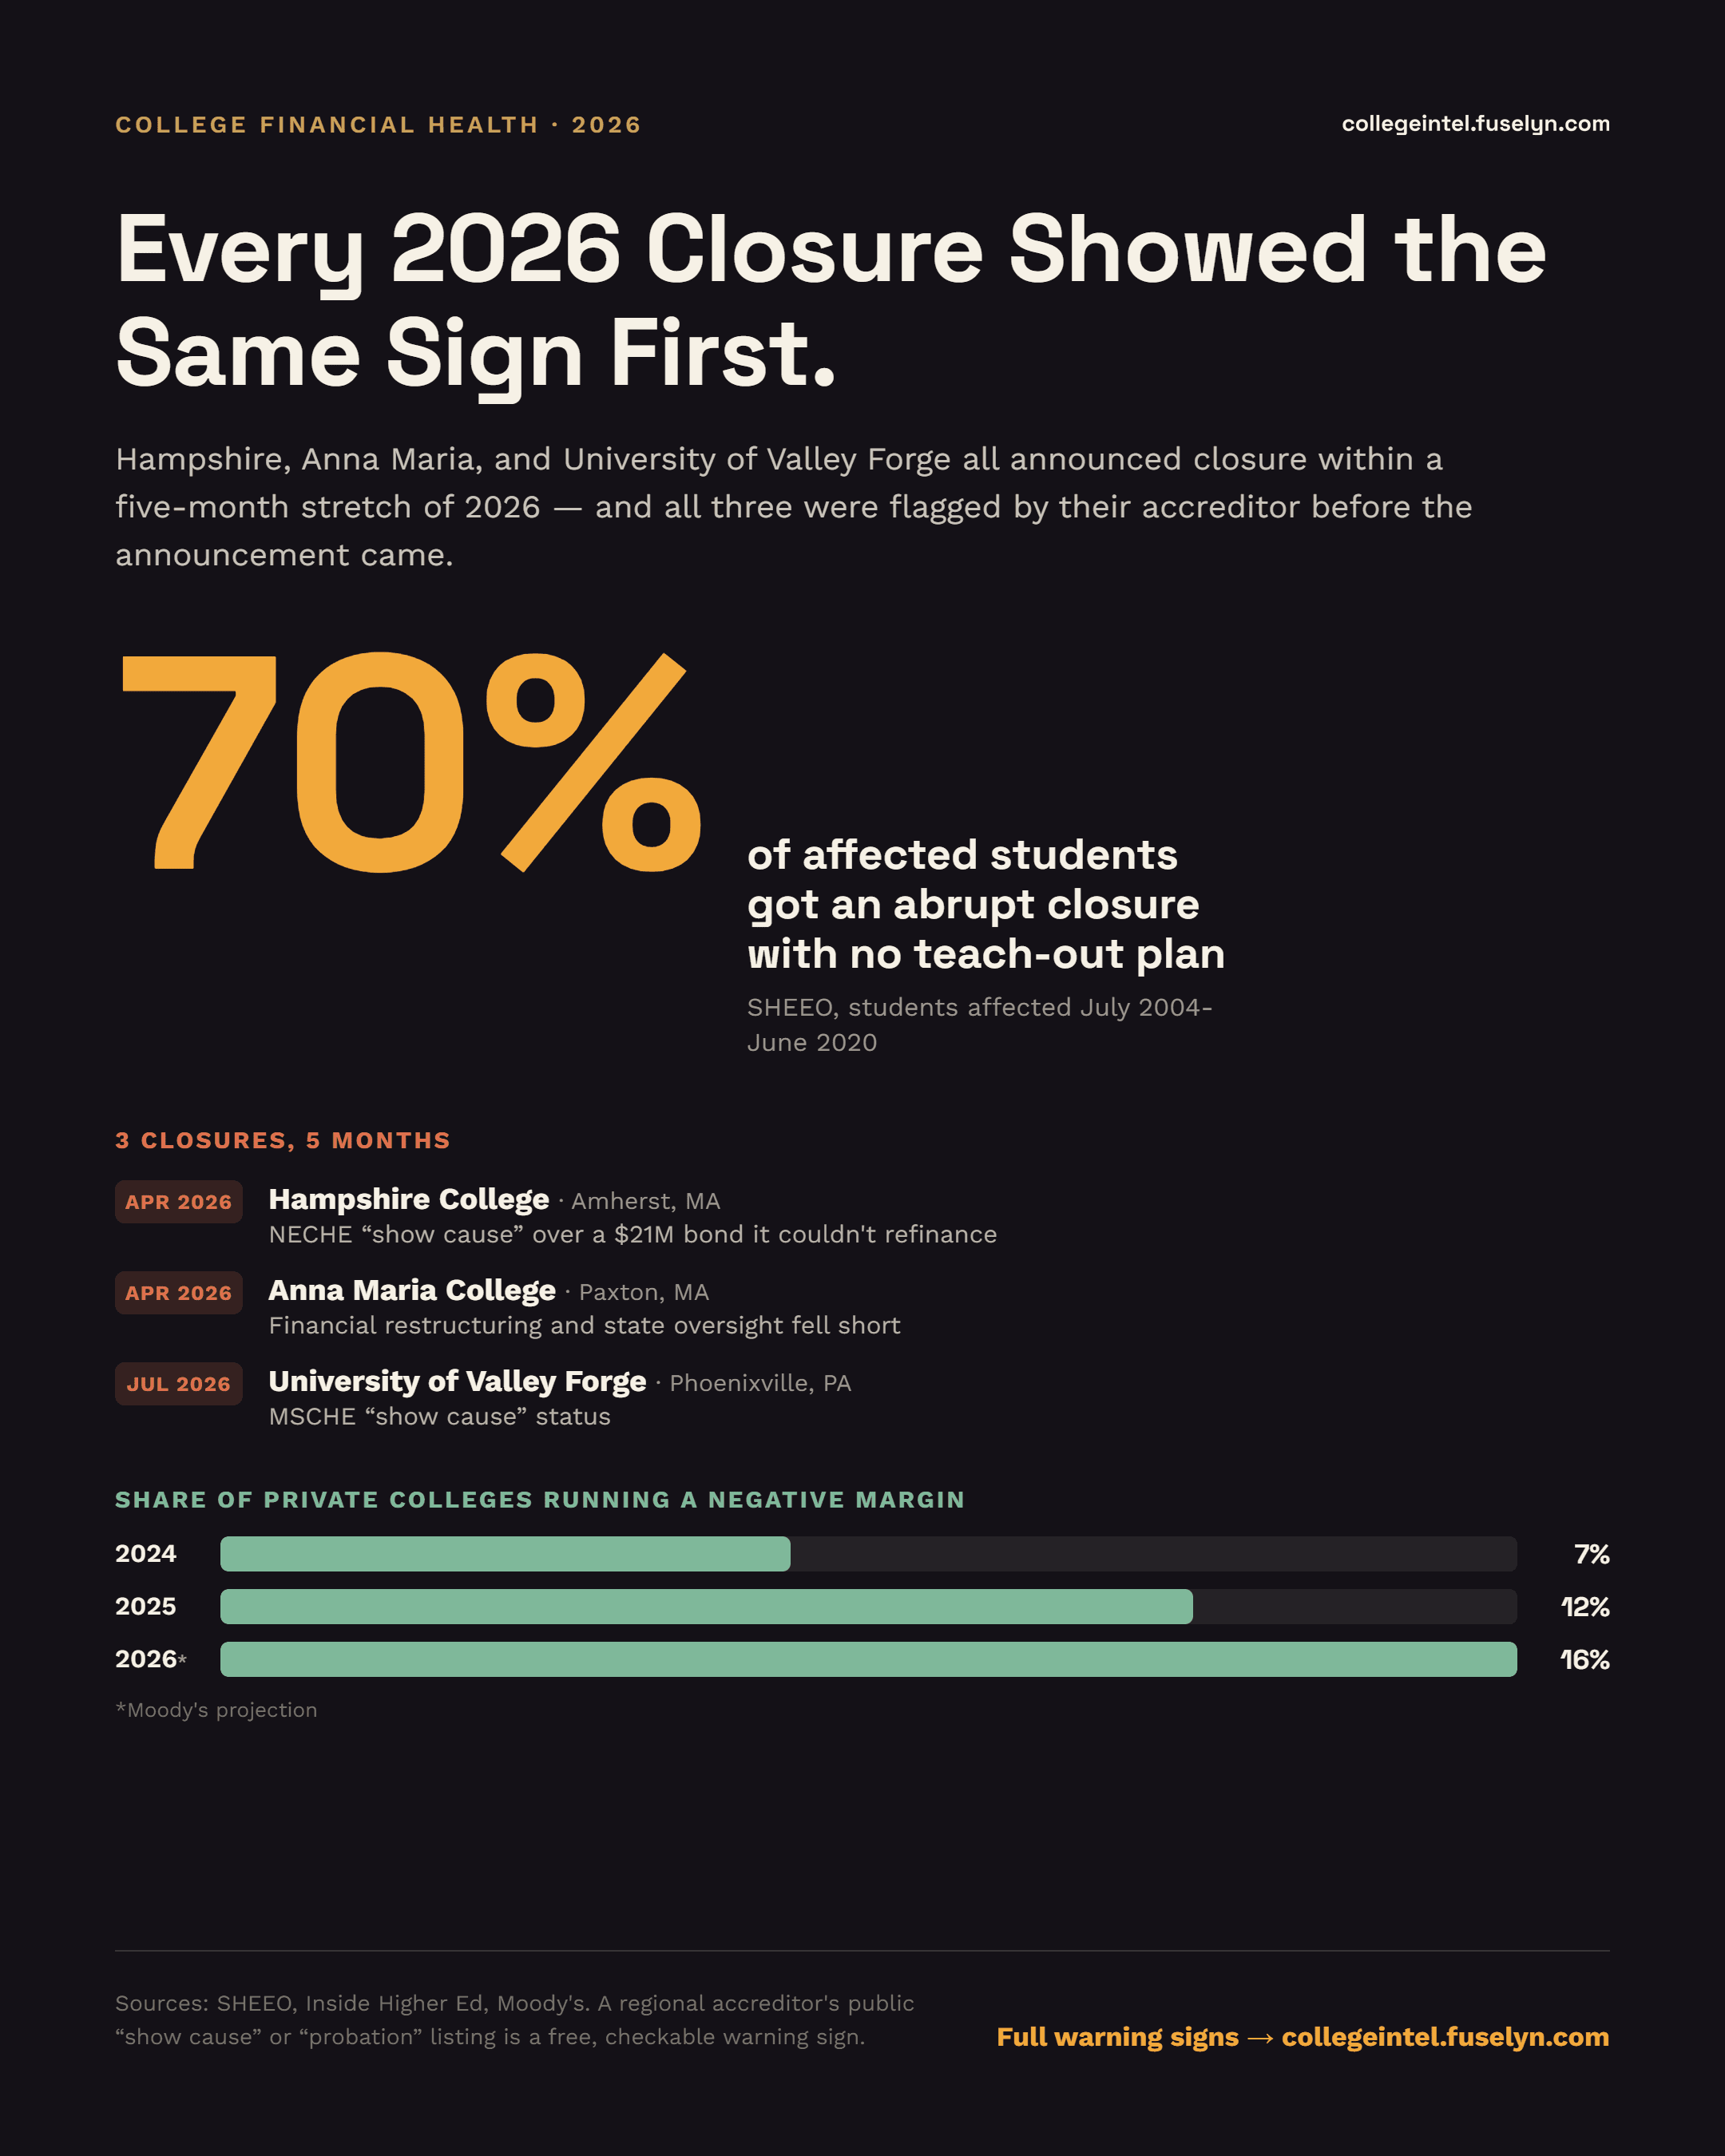
Infographic titled 'Every 2026 Closure Showed the Same Sign First.' 70% of affected students got an abrupt closure with no teach-out plan (SHEEO). Timeline of 3 closures in 5 months: Hampshire College (Amherst, MA, April 2026, NECHE show-cause over a $21M bond), Anna Maria College (Paxton, MA, April 2026, financial restructuring fell short), University of Valley Forge (Phoenixville, PA, July 2026, MSCHE show-cause status) -- all three flagged by their accreditor before the announcement. Share of private colleges running a negative margin: 7% in 2024, 12% in 2025, 16% projected in 2026 (Moody's).
Download printable PDFDownload for social (square)

Sources: SHEEO, Inside Higher Ed, Moody's.

National Merit cutoffs by state

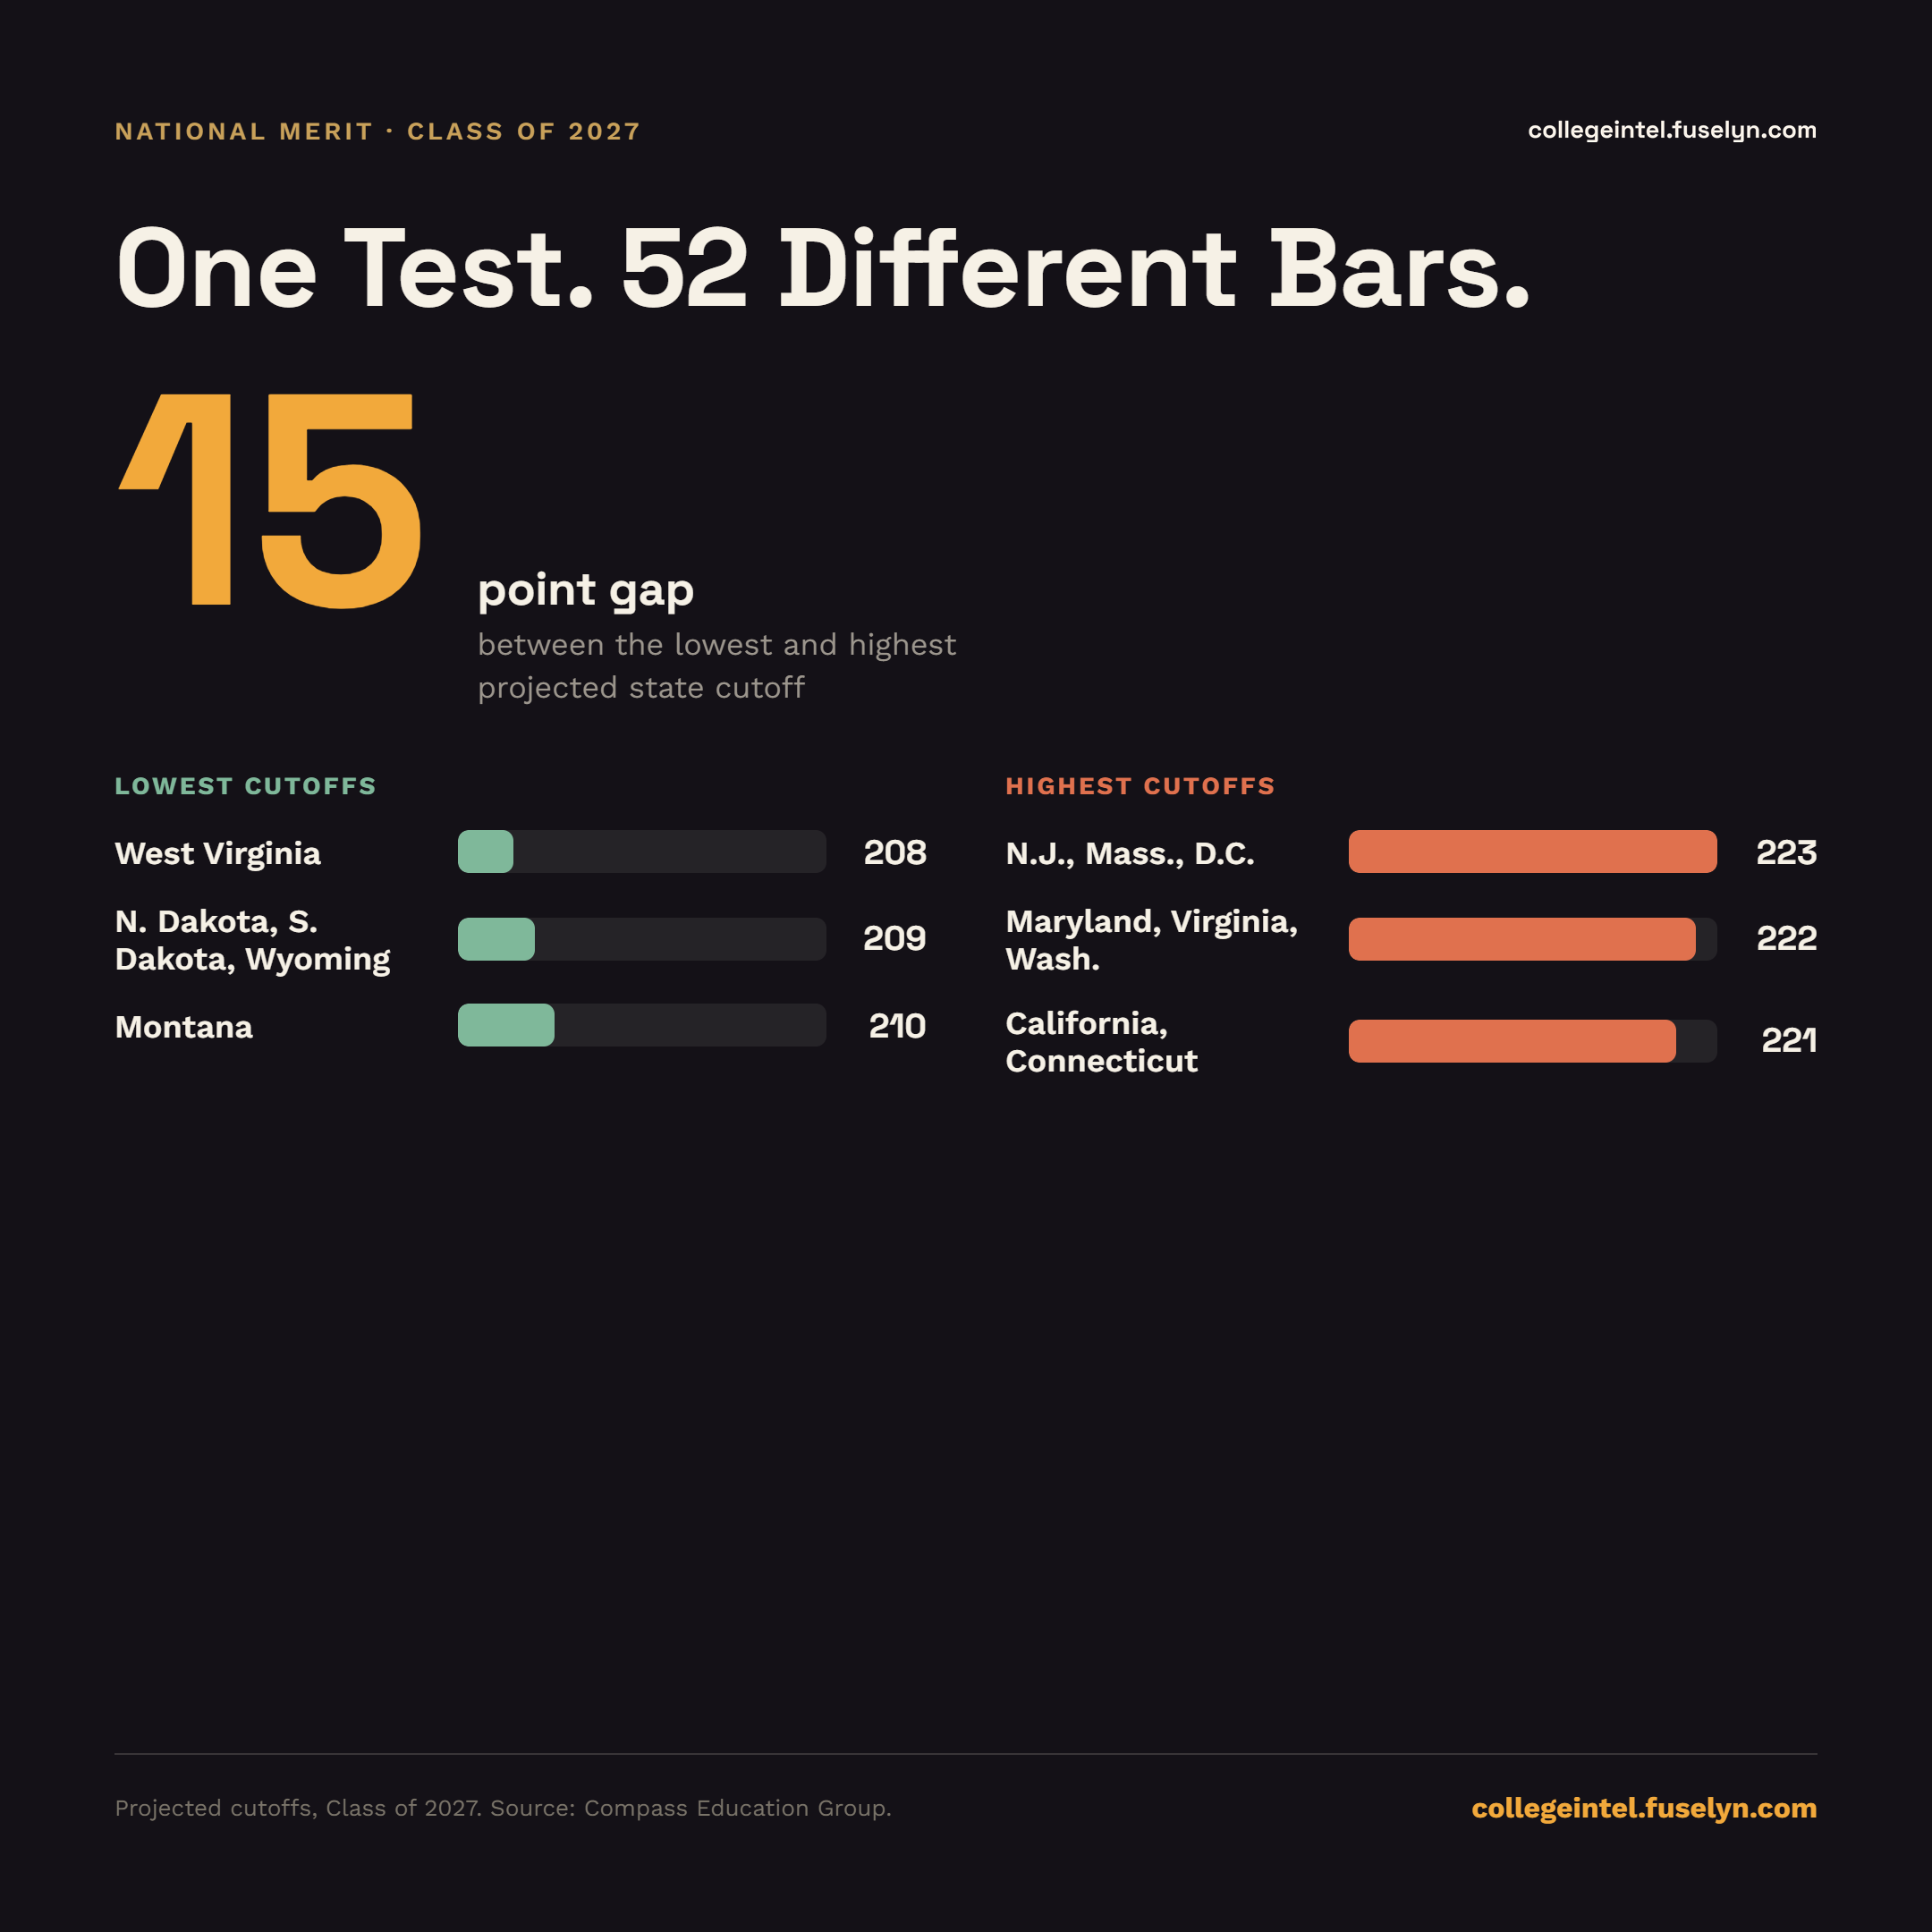
National Merit Semifinalist cutoffs are set state by state, not nationally -- here's the projected 15-point gap between the easiest and hardest state to qualify, distilled down to the single number that matters most. Read the full article.
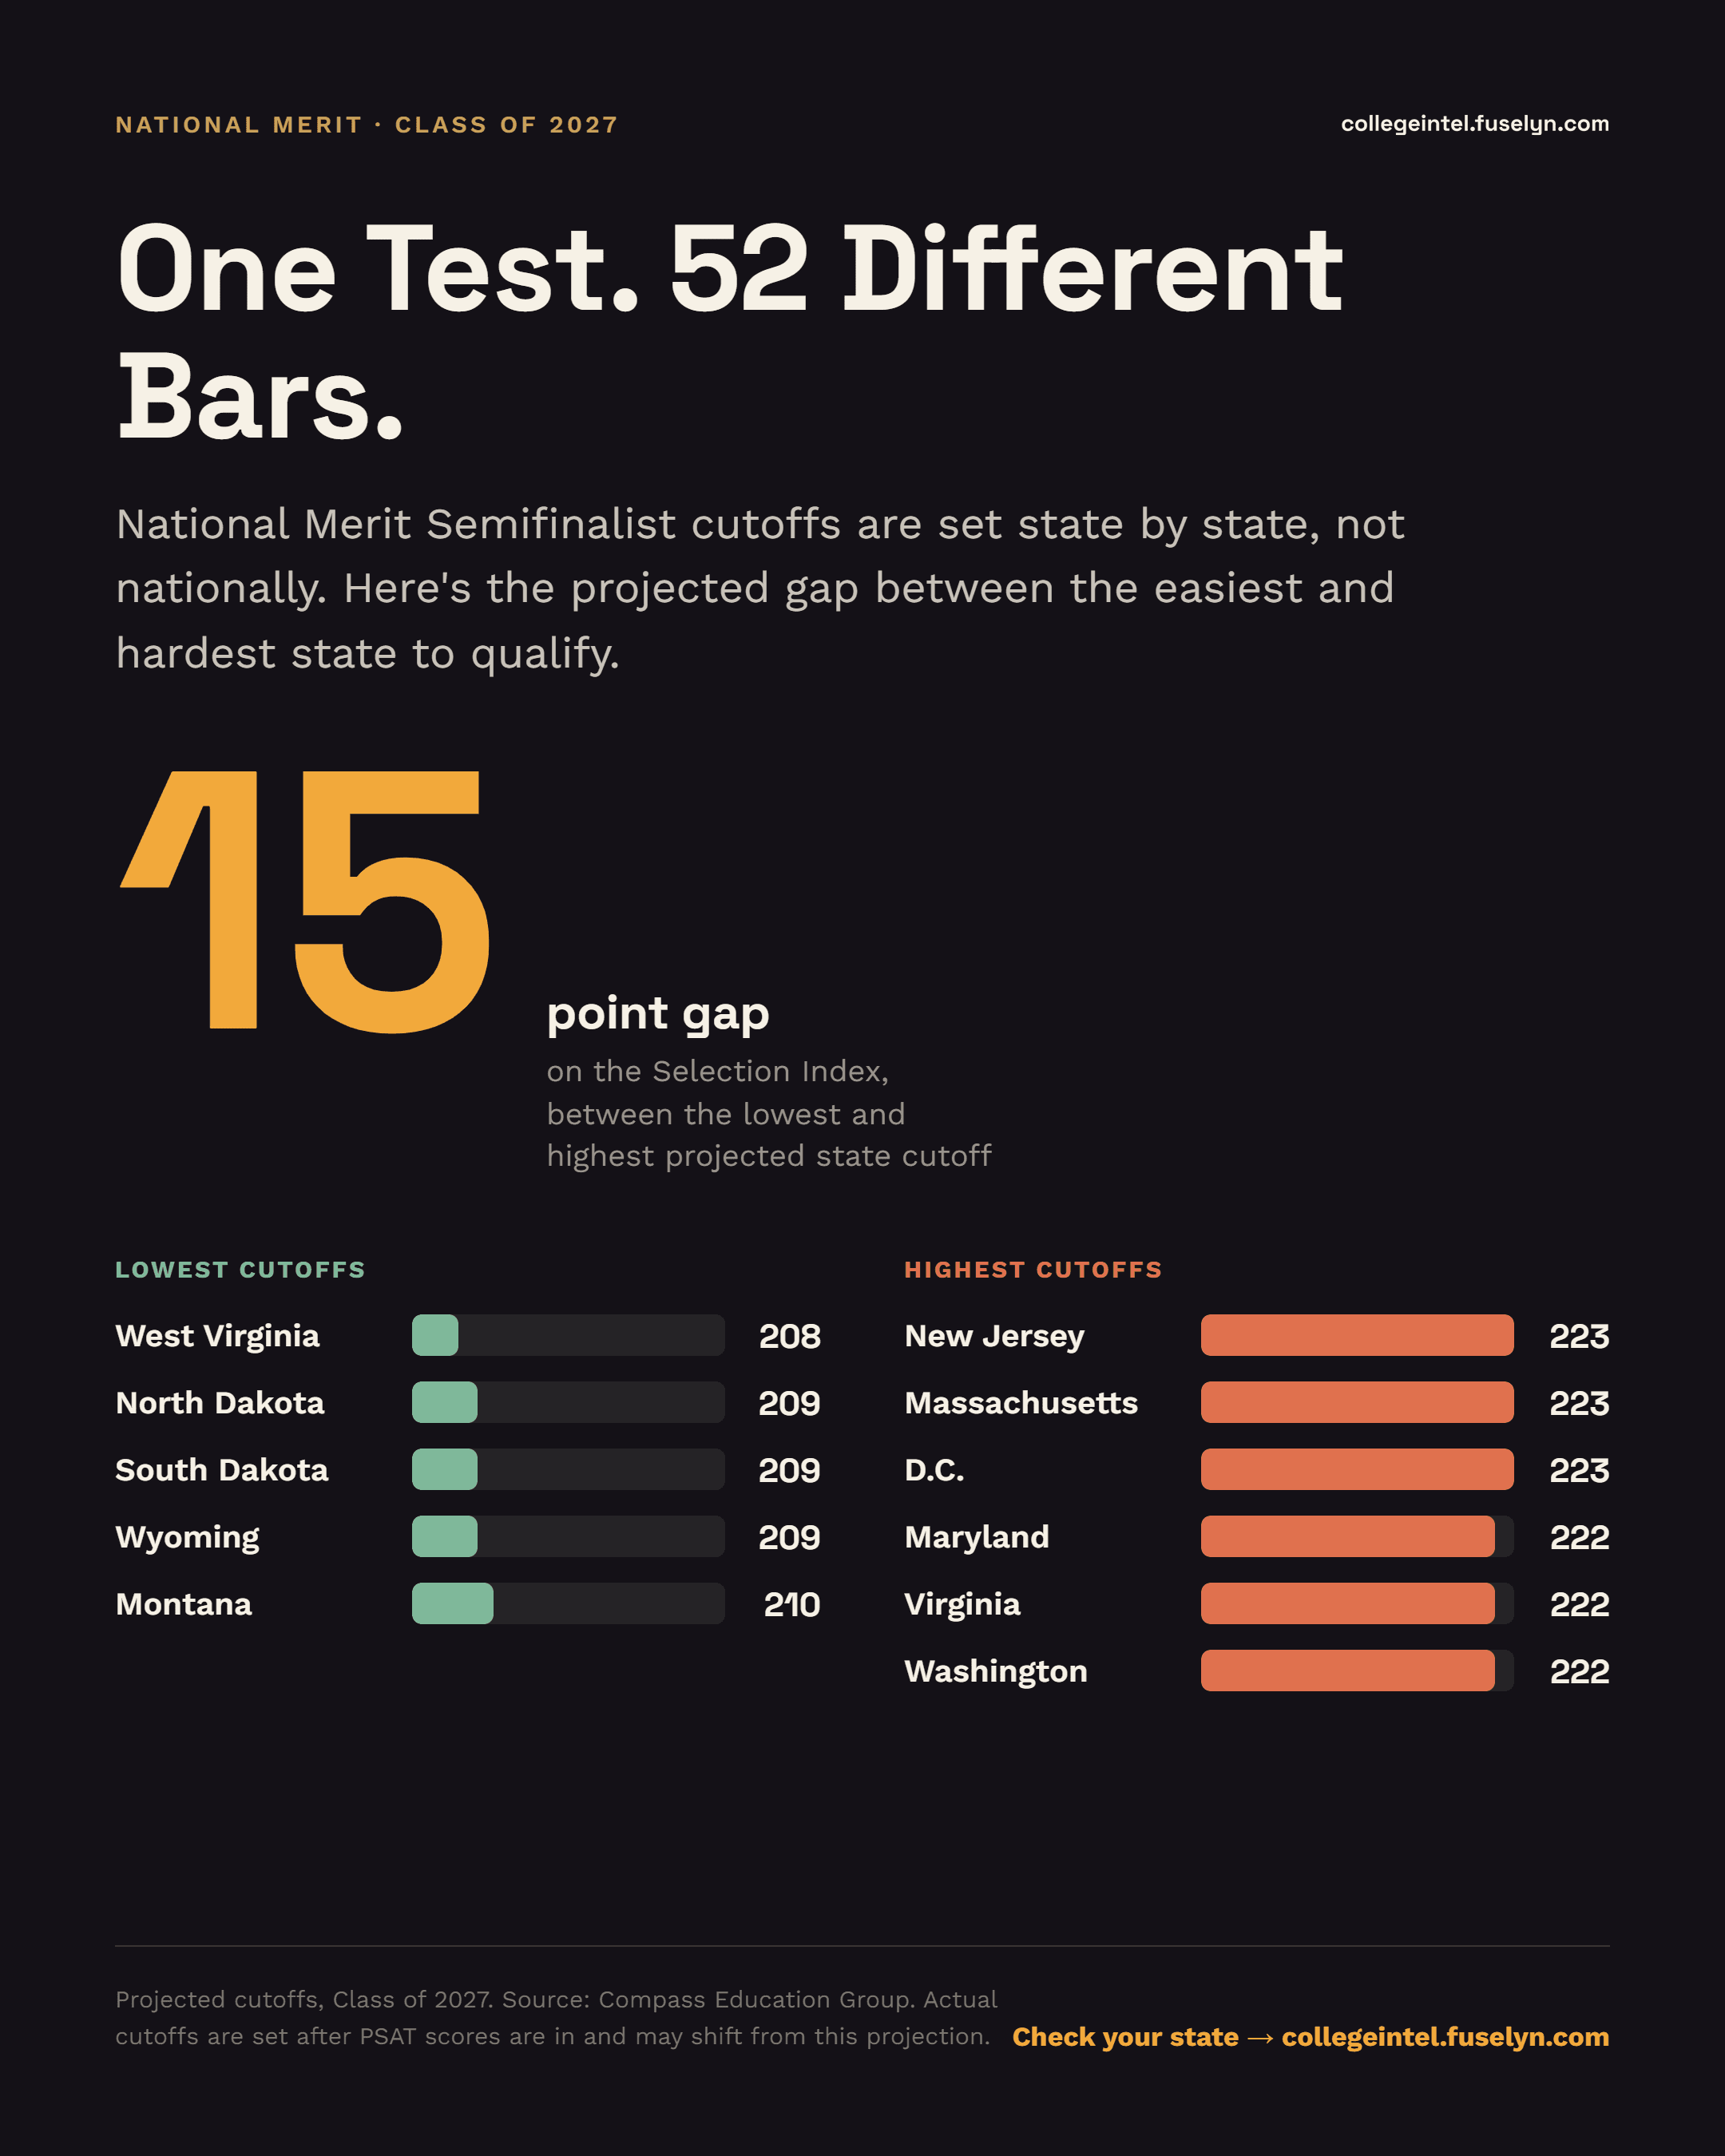
Infographic titled 'One Test. 52 Different Bars.' National Merit Class of 2027 Semifinalist cutoffs: a 15-point gap on the Selection Index separates the lowest cutoffs (West Virginia 208, North Dakota/South Dakota/Wyoming 209, Montana 210) from the highest (New Jersey/Massachusetts/D.C. 223, Maryland/Virginia/Washington 222).
Download printable PDFDownload for social (square)

Source: Compass Education Group.

One Average. Twenty-Five Very Different Odds.

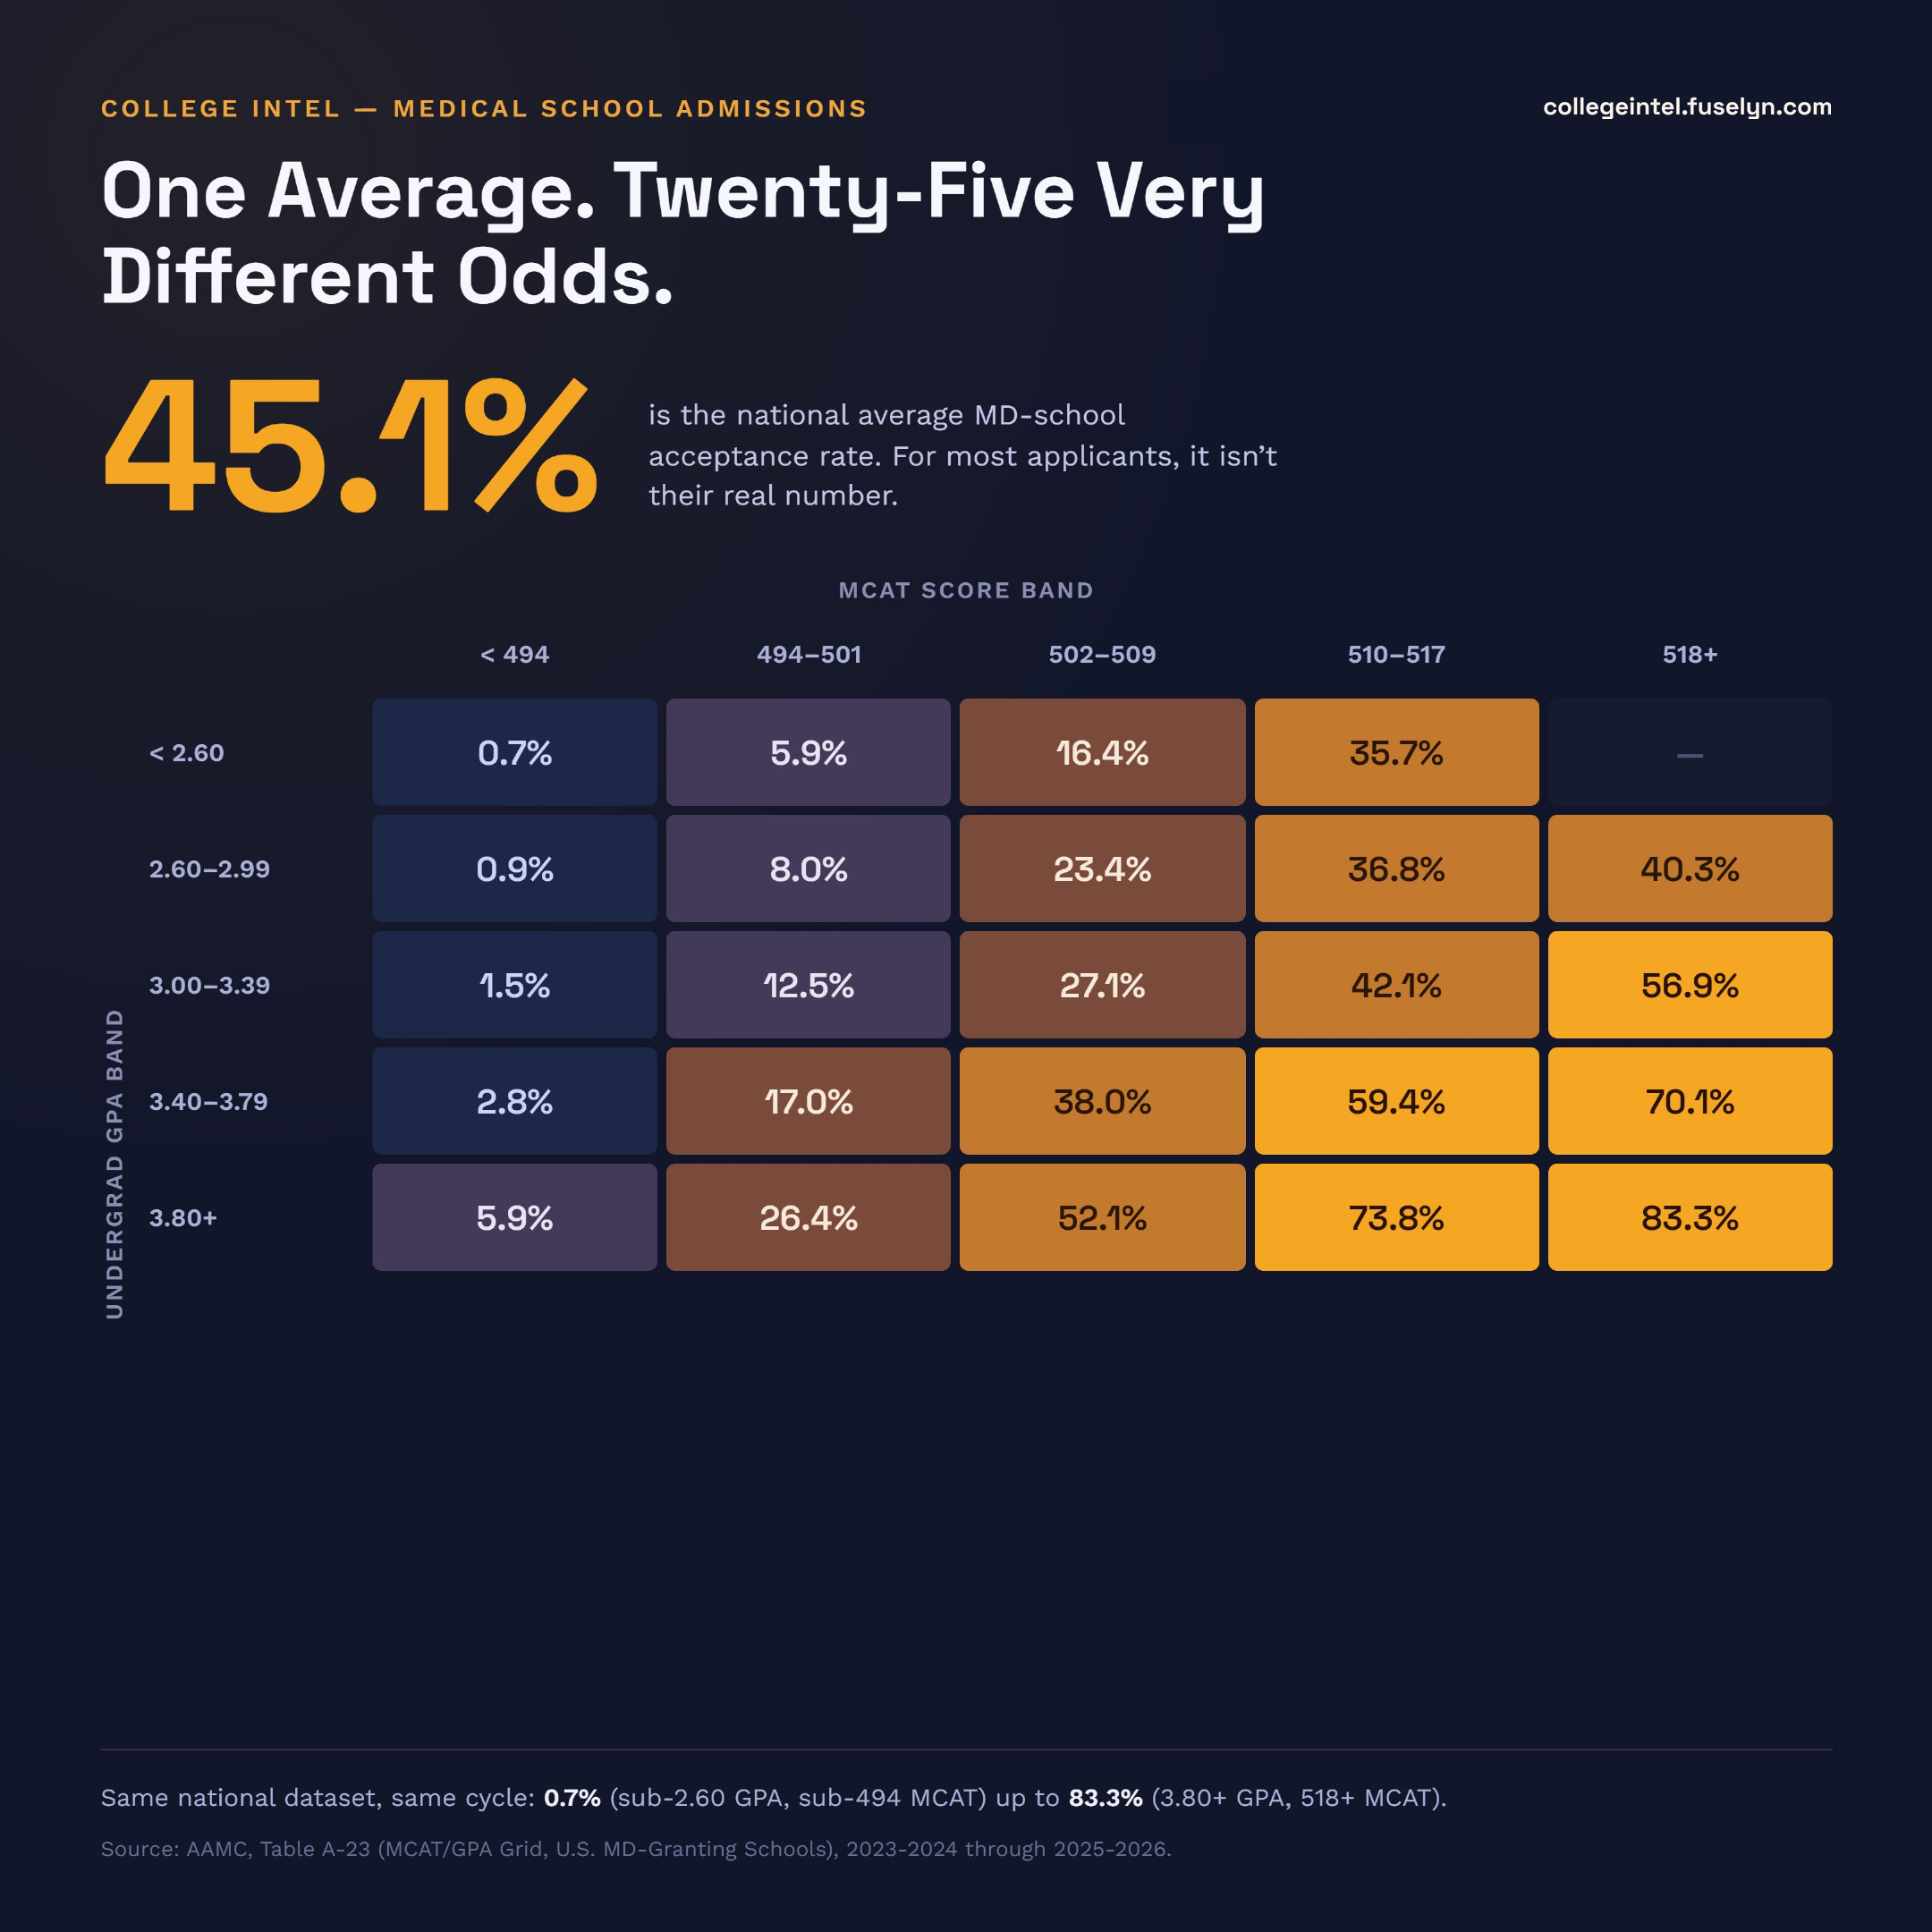
AAMC's own MCAT/GPA grid shows the real national medical-school acceptance rate swinging from under 1% to over 80% depending on where a specific score combination lands -- the 45.1% overall average almost nobody actually gets. See the full grid, and how to read your own combination, in our full article. Read the full article.
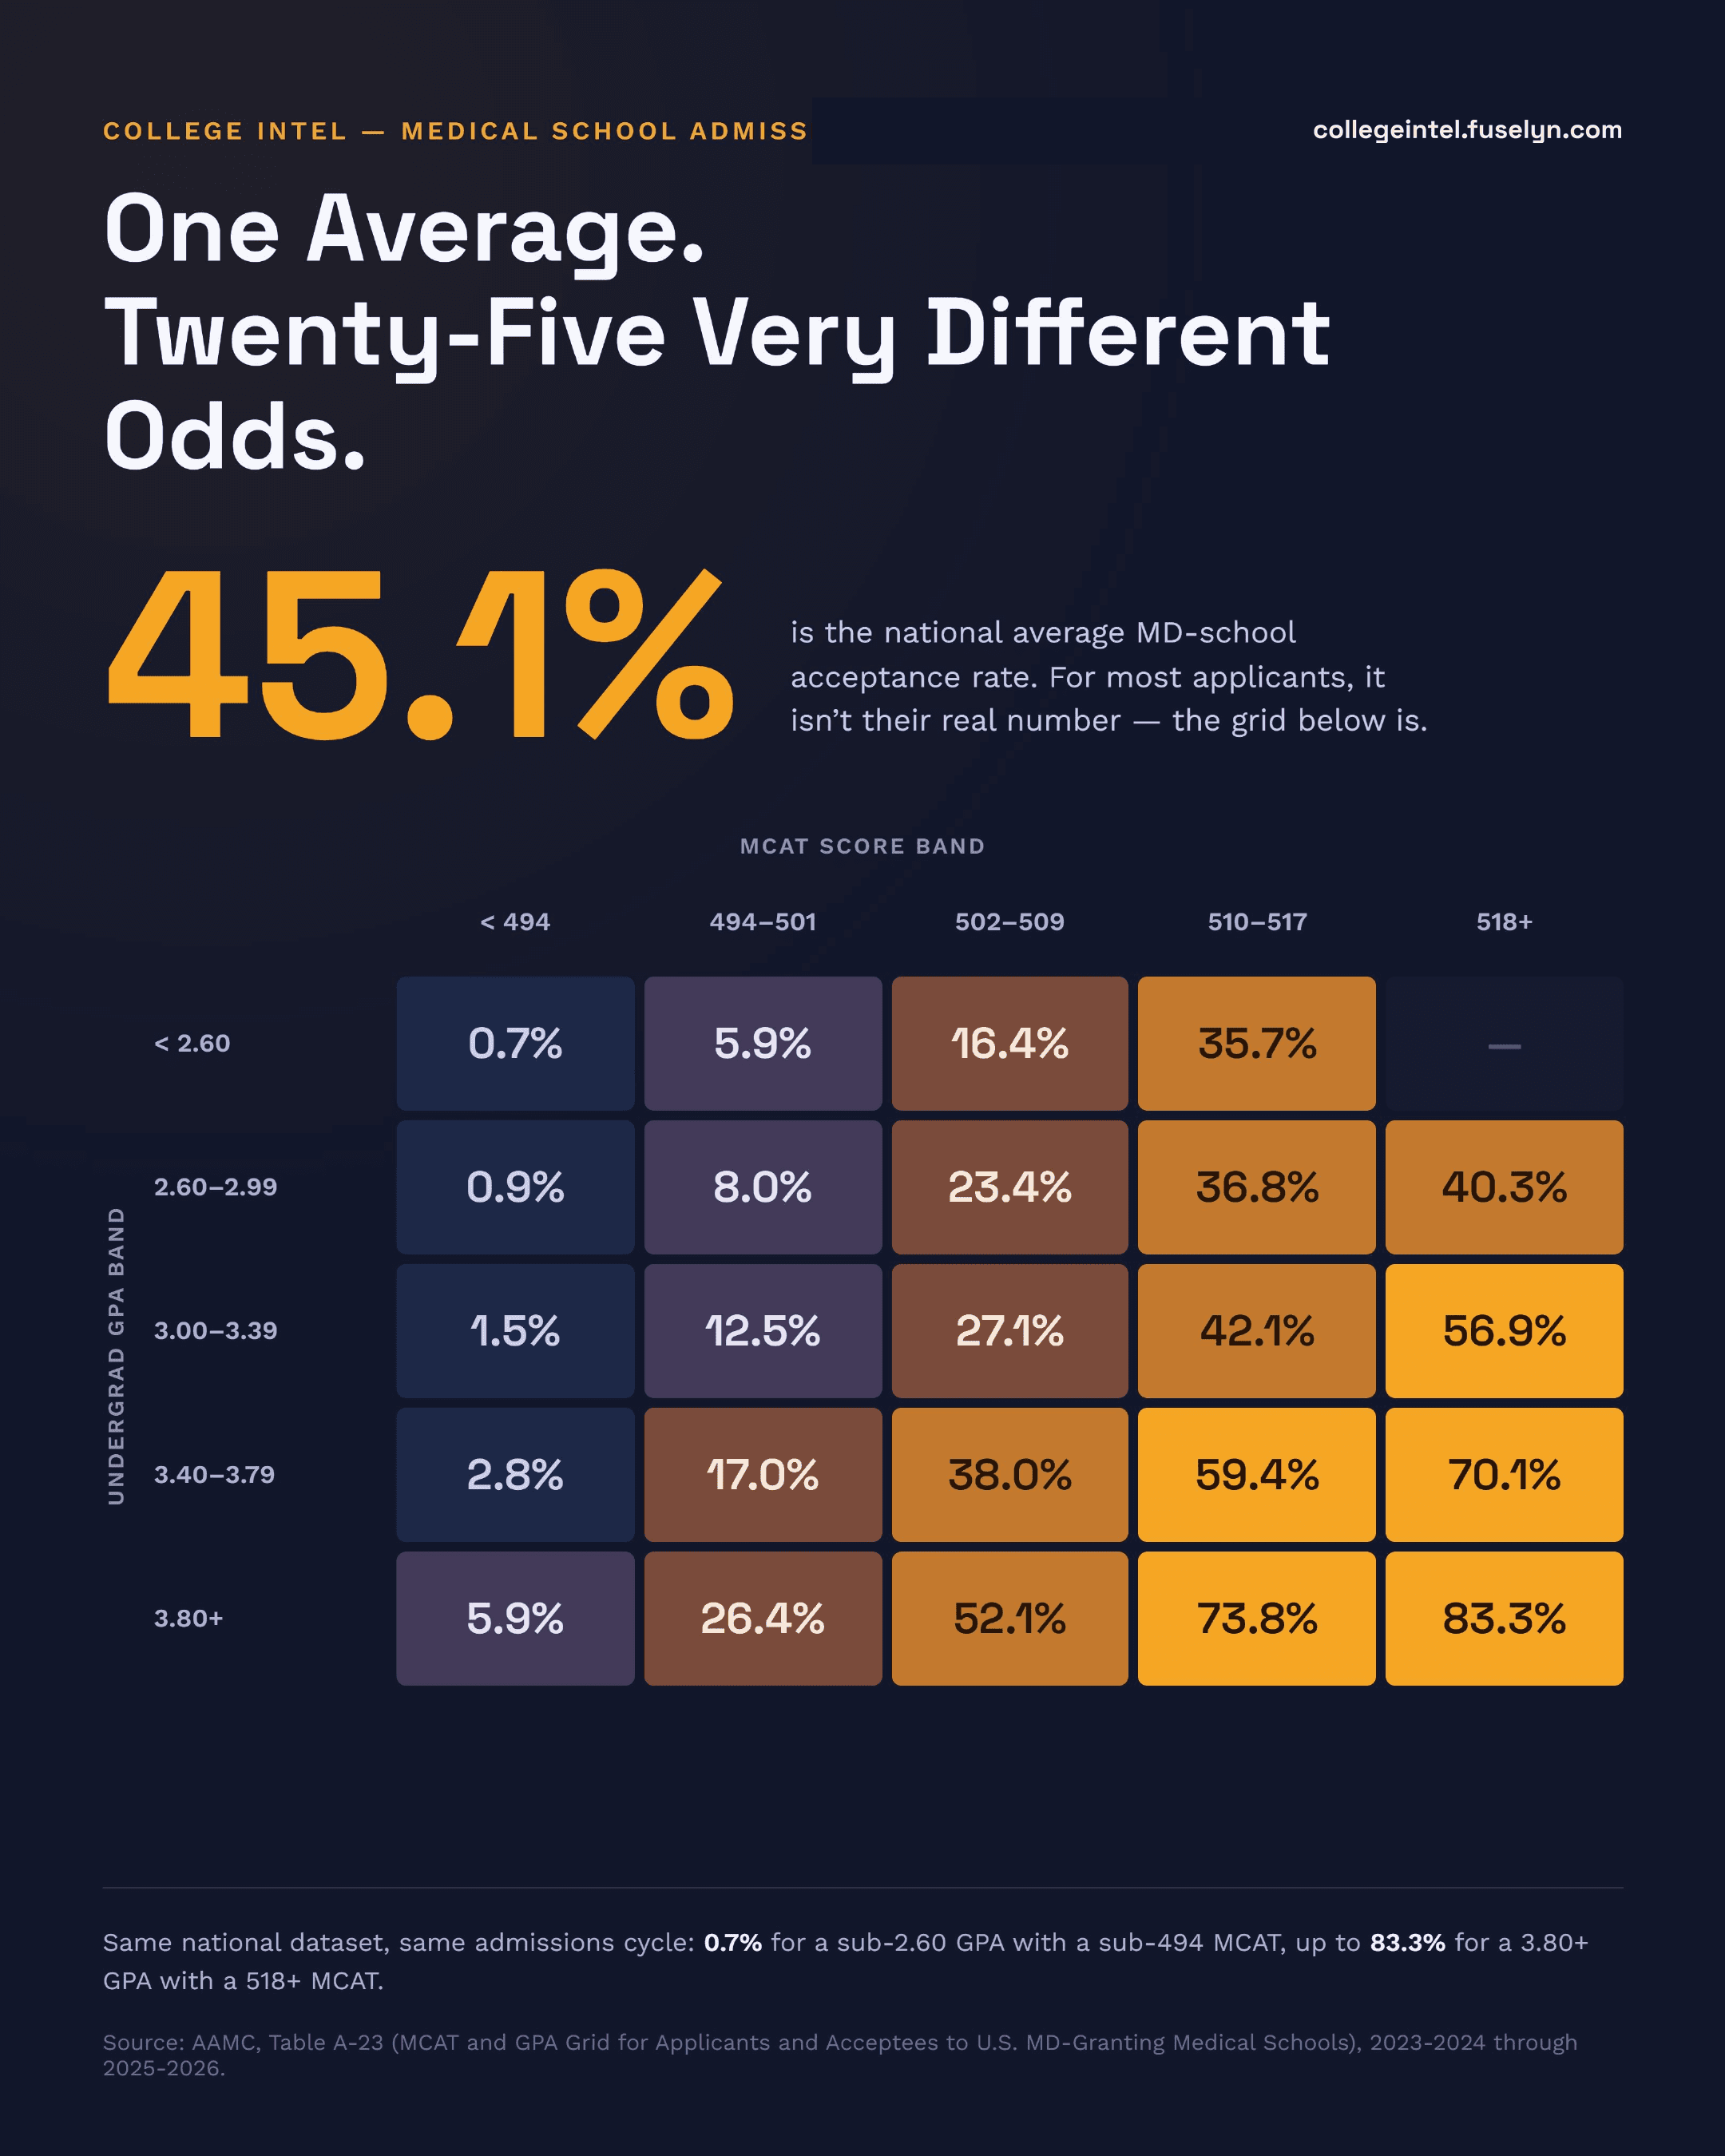
Infographic titled 'One Average. Twenty-Five Very Different Odds.' 45.1% is the national average MD-school acceptance rate, for most applicants not their real number. Heatmap grid of AAMC's MCAT/GPA acceptance-rate table, GPA bands (below 2.60, 2.60-2.99, 3.00-3.39, 3.40-3.79, 3.80+) by MCAT bands (below 494, 494-501, 502-509, 510-517, 518+): rates range from 0.7% (below 2.60 GPA, below 494 MCAT) up to 83.3% (3.80+ GPA, 518+ MCAT), with one suppressed cell (below 2.60 GPA, 518+ MCAT) shown as a dash for too few applicants. Footnote: same national dataset, same admissions cycle, 0.7% up to 83.3%.
Download printable PDFDownload for social (square)

Source: AAMC, Table A-23 (MCAT and GPA Grid for Applicants and Acceptees to U.S. MD-Granting Medical Schools), 2023-2024 through 2025-2026.

Same Applicants. Two Rounds. Not the Same Odds.

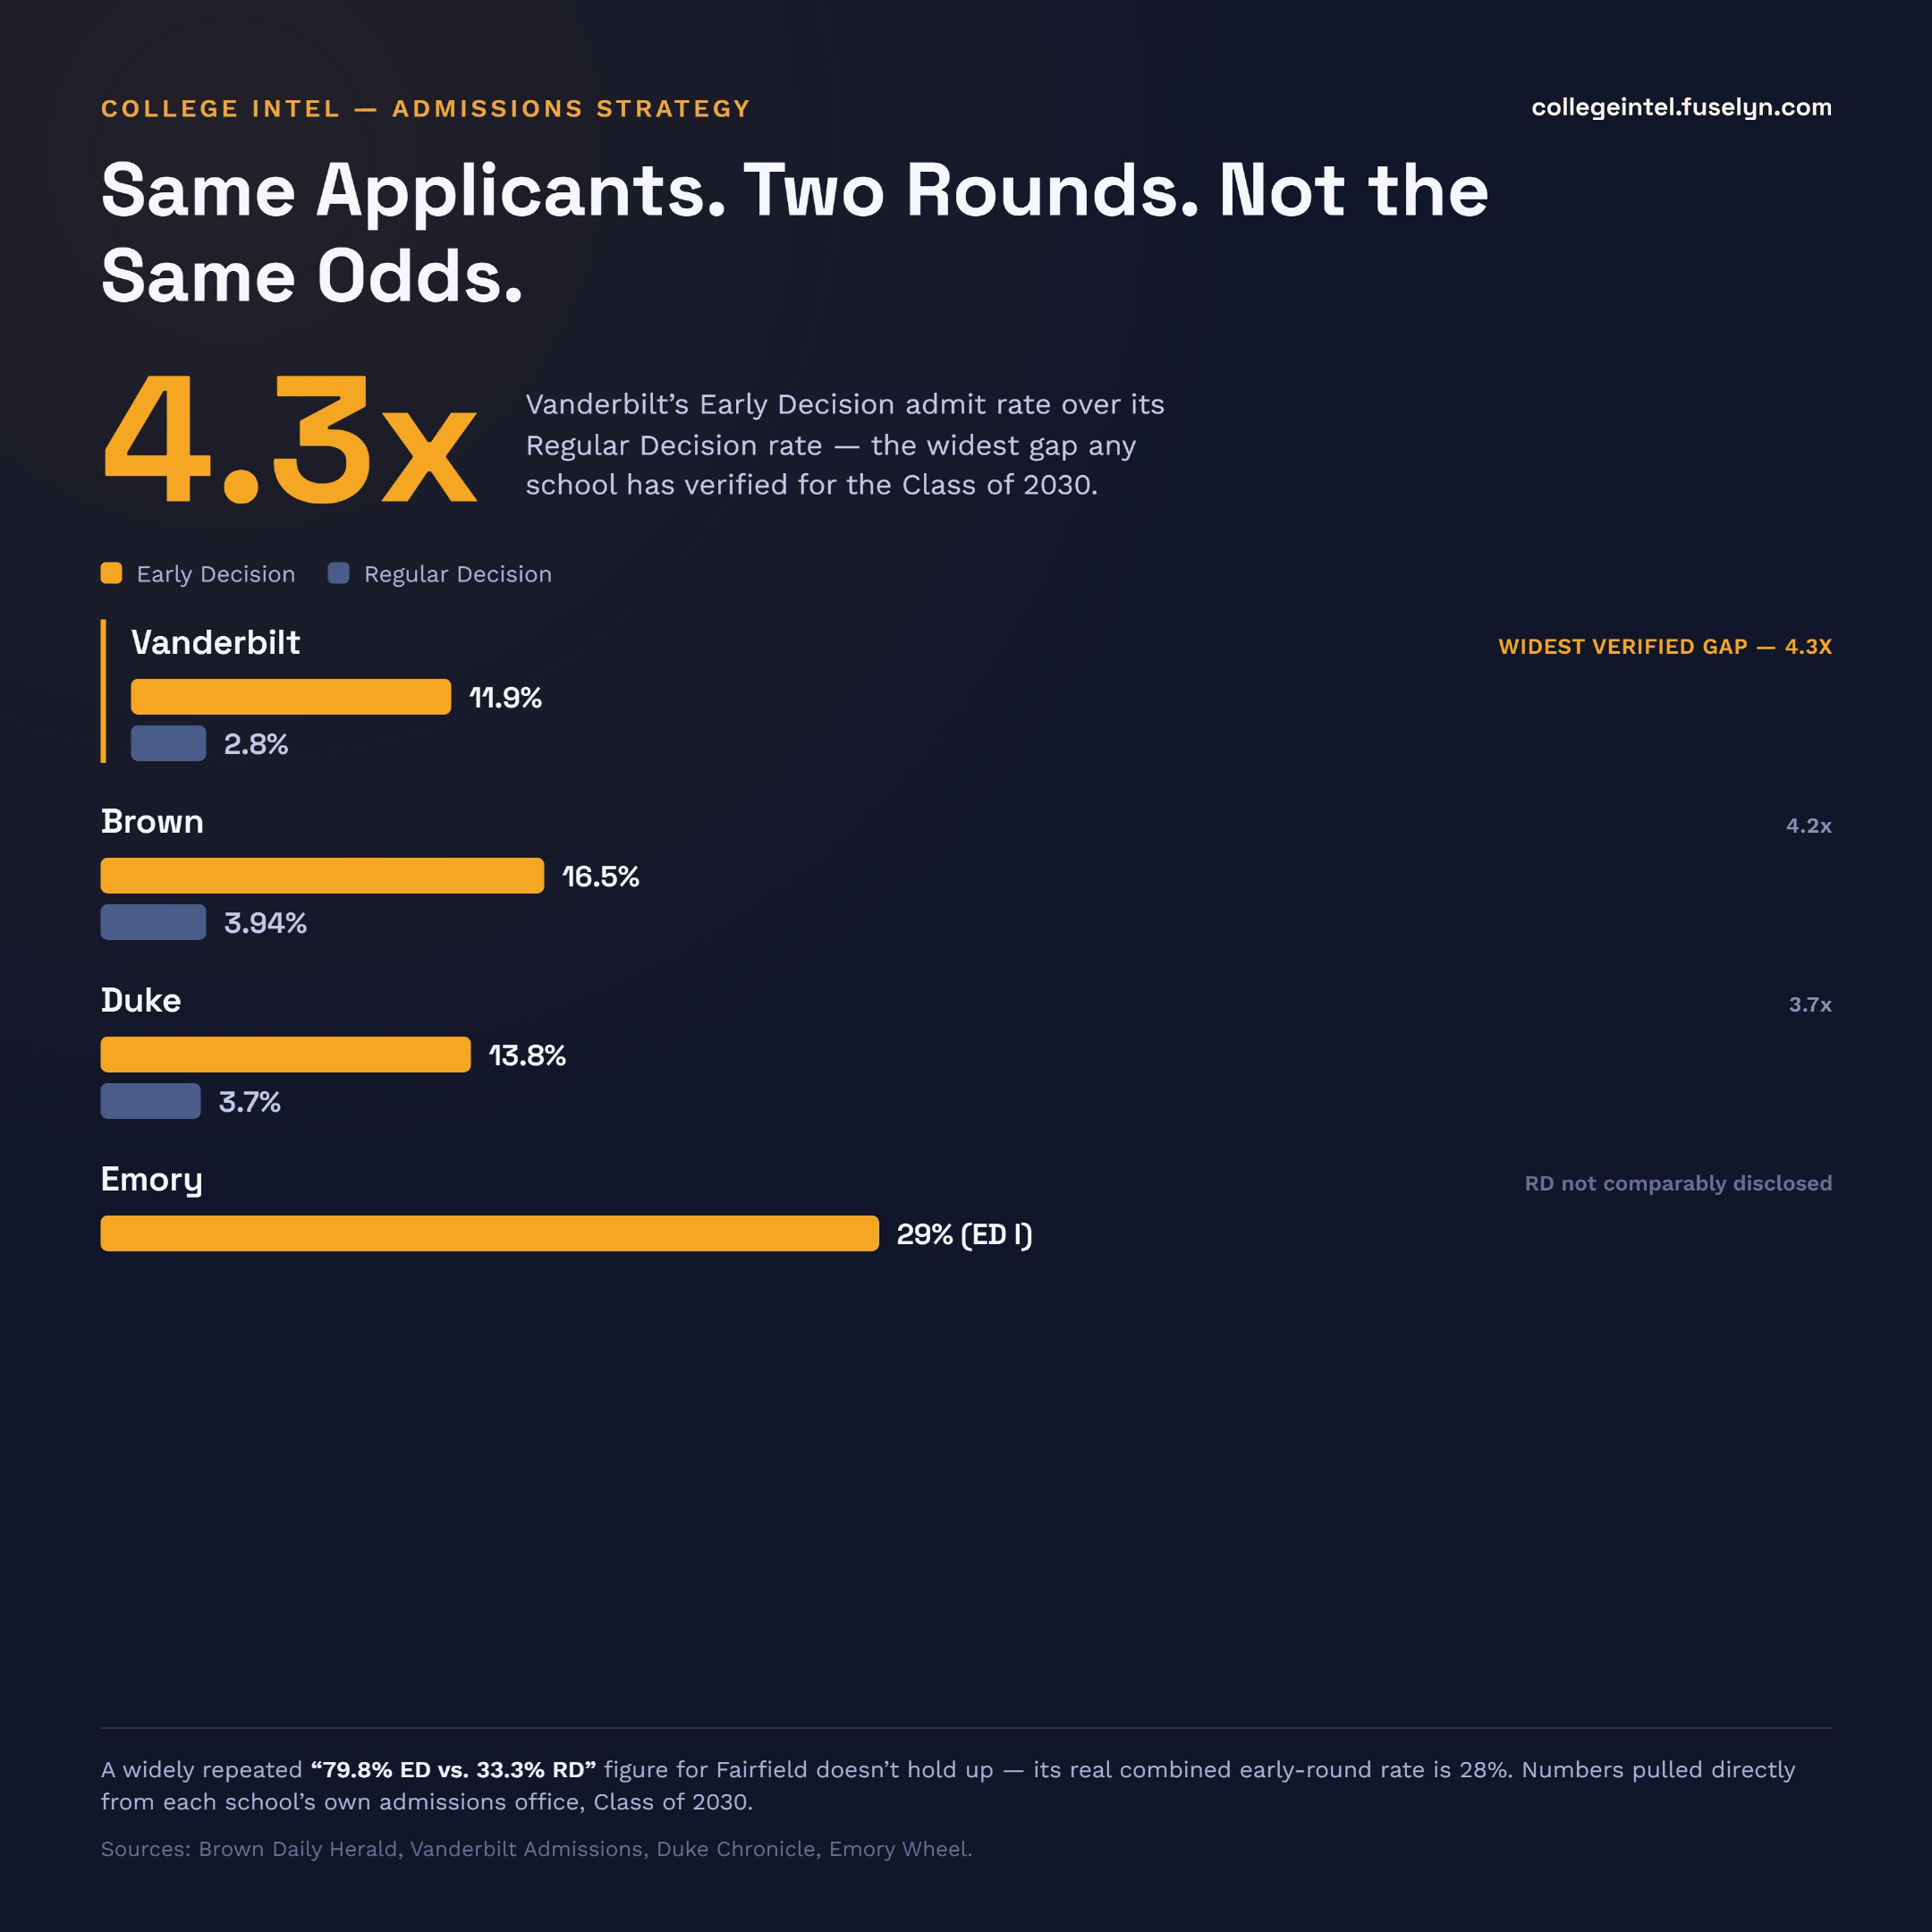
Vanderbilt admitted 11.9% of Early Decision applicants but just 2.8% of Regular Decision applicants for the Class of 2030 -- a 4.3x gap, verified straight from the school's own admissions office, not a rumor site's rounded-up estimate. See the full school-by-school breakdown, and a widely repeated stat that doesn't hold up, in our full article. Read the full article.
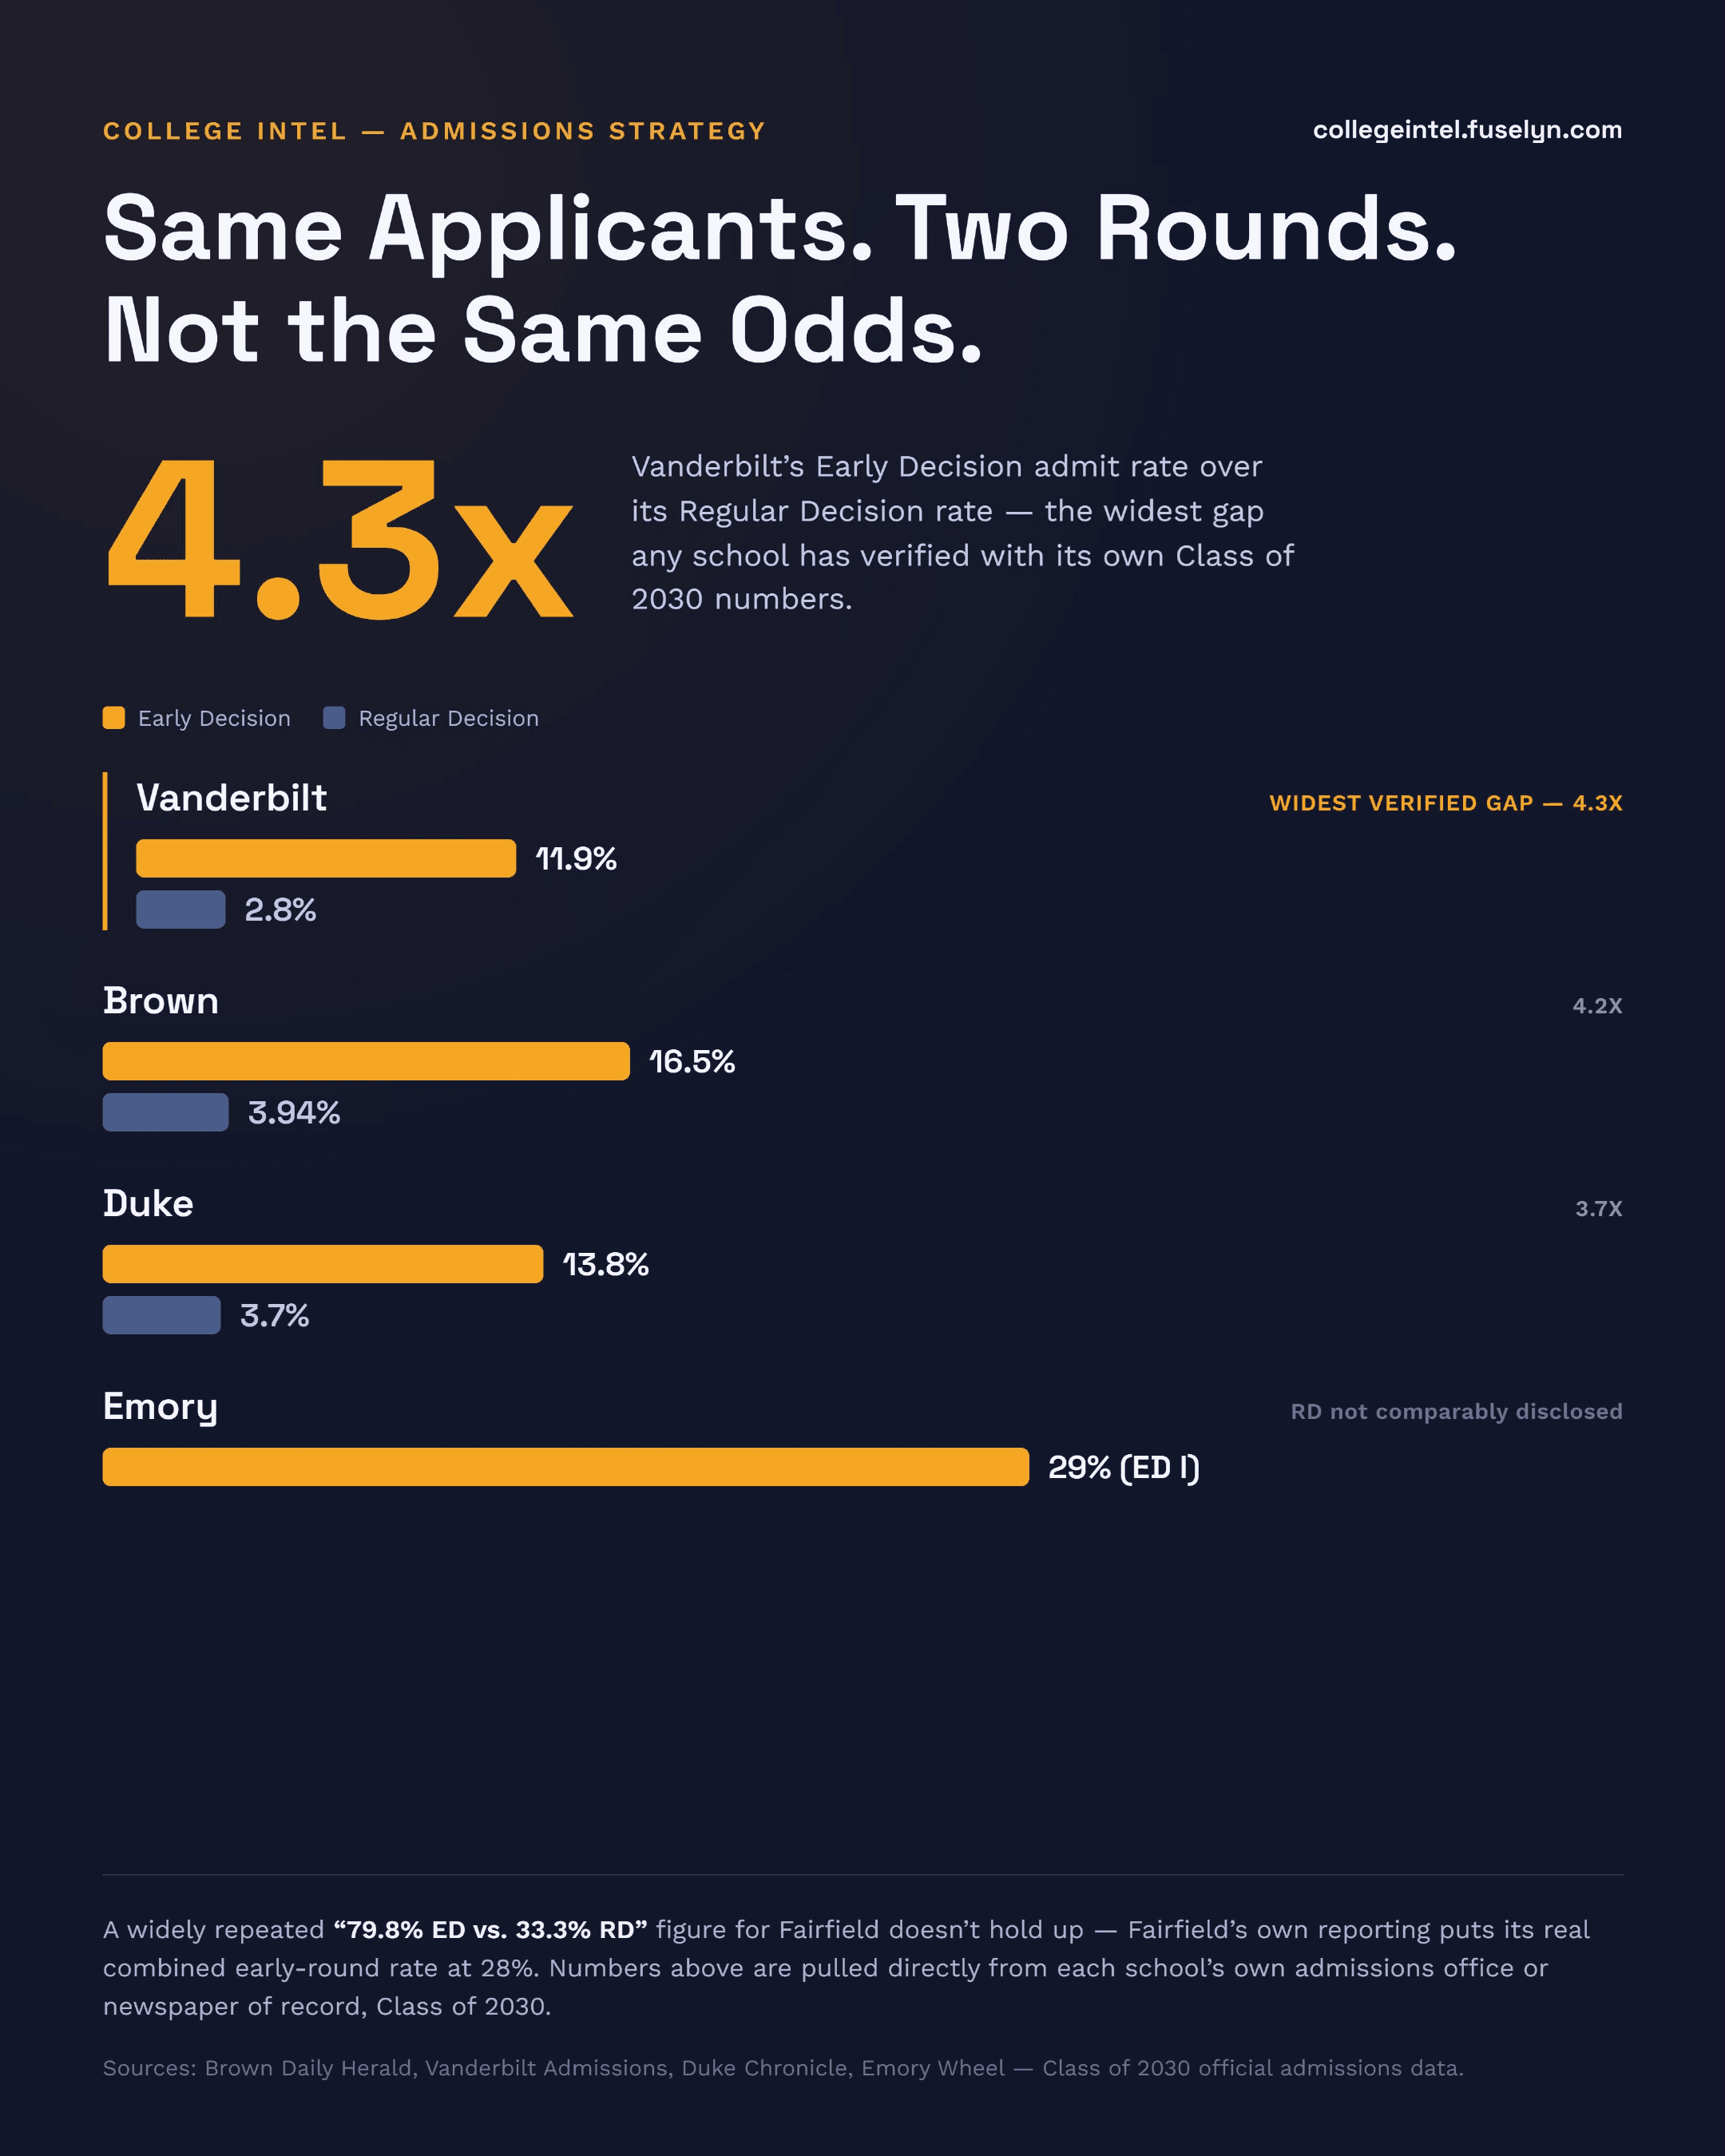
Infographic titled 'Same Applicants. Two Rounds. Not the Same Odds.' 4.3x -- Vanderbilt's Early Decision admit rate over its Regular Decision rate, the widest verified gap for the Class of 2030. Grouped bars, Early Decision vs Regular Decision admit rate by school: Vanderbilt 11.9% vs 2.8% (4.3x), Brown 16.5% vs 3.94% (4.2x), Duke 13.8% vs 3.7% (3.7x), Emory 29% ED I (RD not comparably disclosed). Footnote: a widely repeated '79.8% ED vs. 33.3% RD' figure for Fairfield doesn't hold up -- Fairfield's own reporting puts its real combined early-round rate at 28%.
Download printable PDFDownload for social (square)

Sources: Brown Daily Herald, Vanderbilt Admissions, Duke Chronicle, Emory Wheel -- Class of 2030 official admissions data.

Are You Actually Bound?

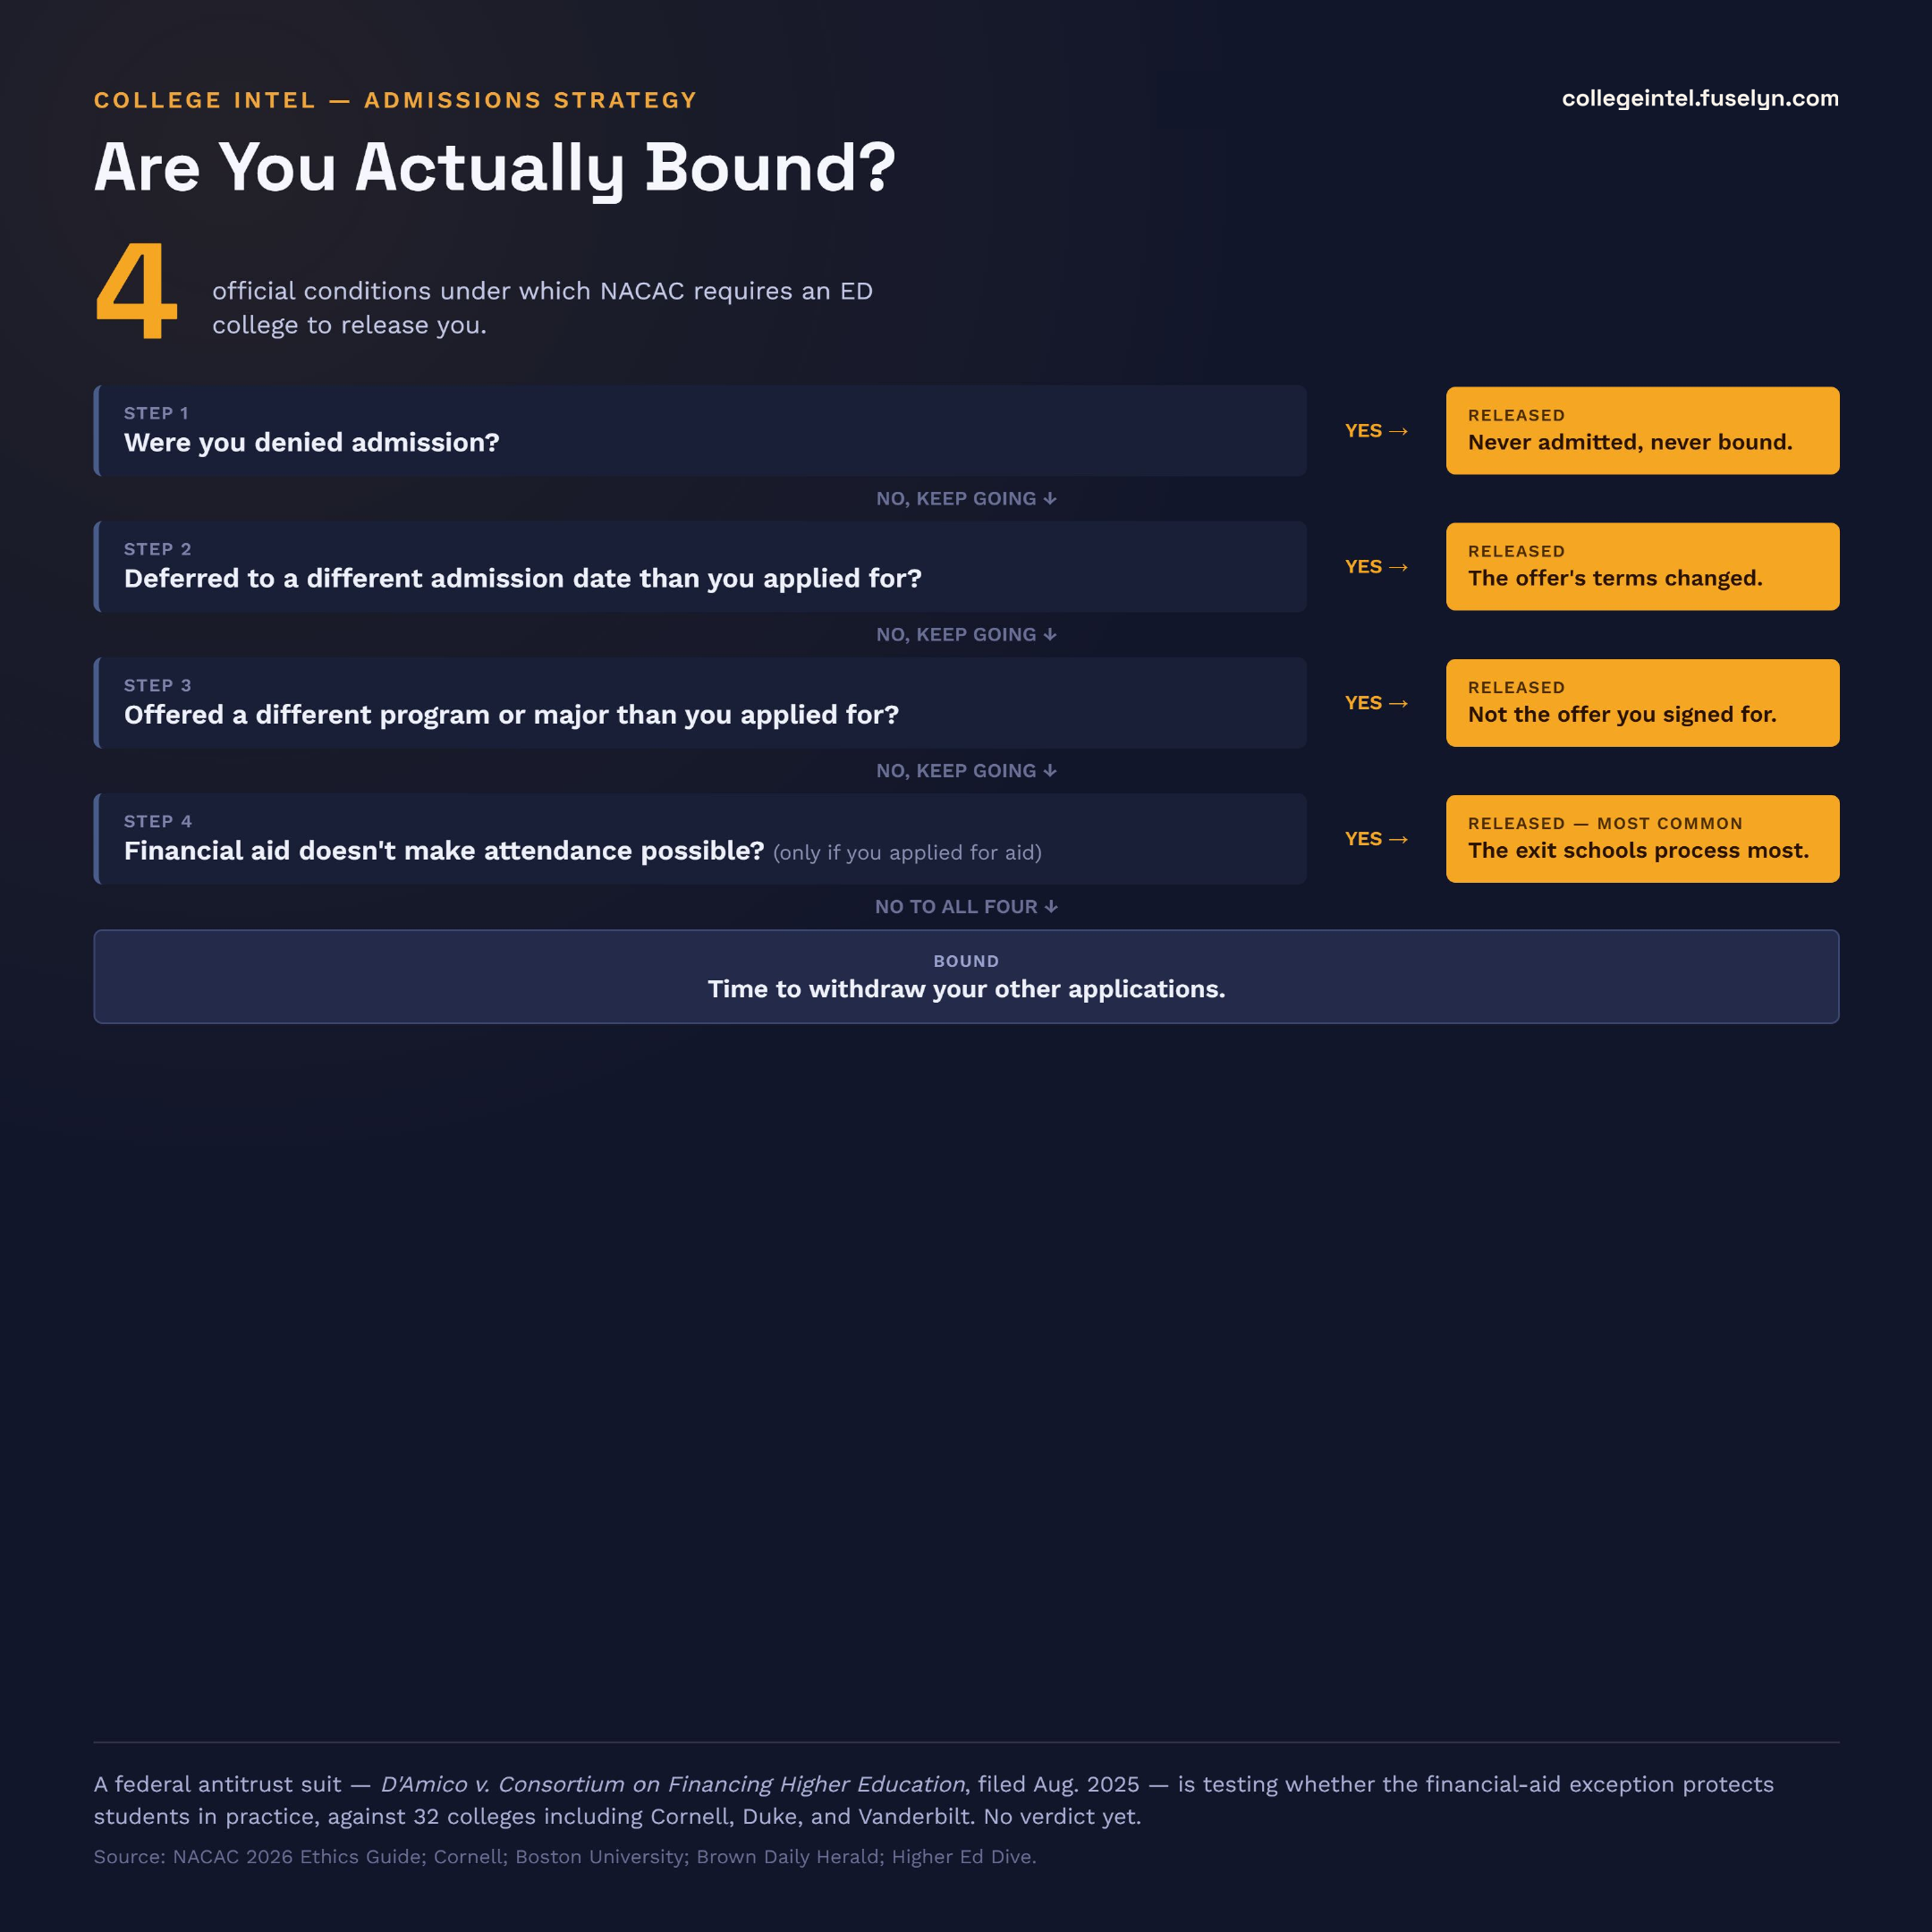
Early Decision agreements say "binding," but NACAC's own ethics code requires every member college to release you in four specific situations -- financial hardship being the one schools process most often. See the full decision tree, and a live lawsuit testing whether that exception holds up in practice, in our full article. Read the full article.
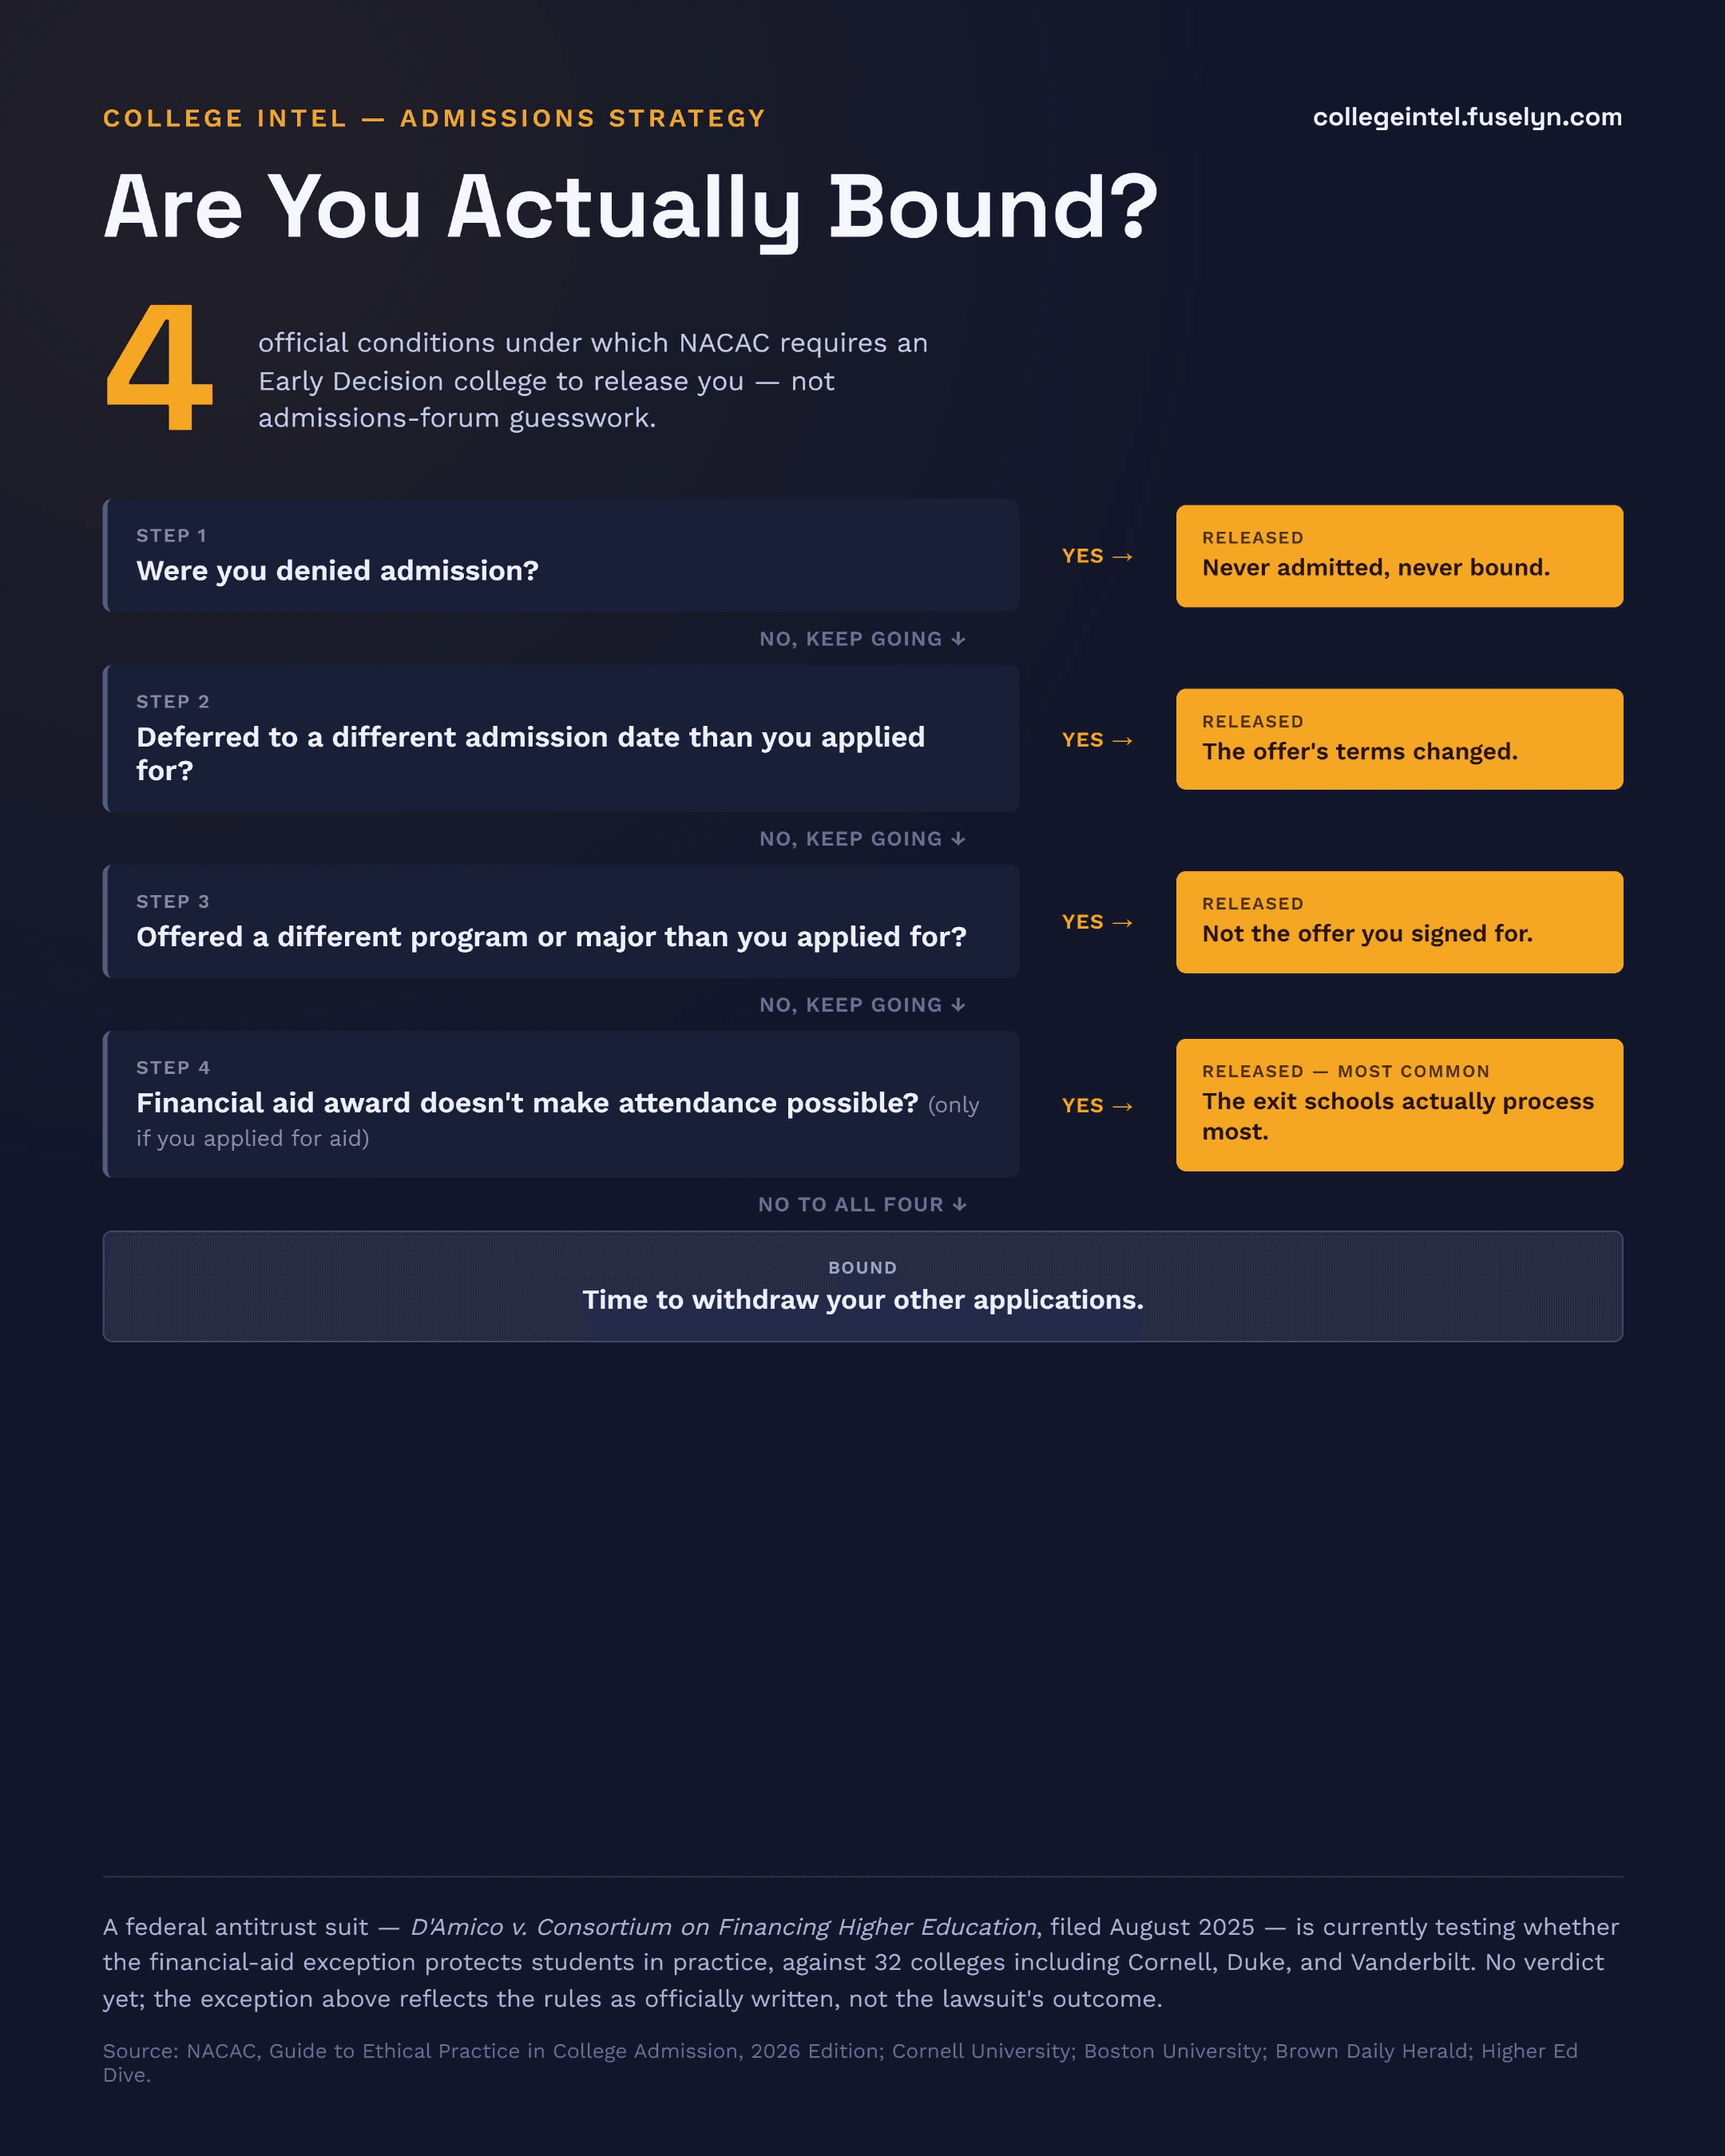
Infographic titled 'Are You Actually Bound?' 4 -- official conditions under which NACAC requires an Early Decision college to release you. Decision tree: Step 1, were you denied admission? Yes -> released, never admitted never bound. Step 2, deferred to a different admission date than you applied for? Yes -> released, the offer's terms changed. Step 3, offered a different program or major than you applied for? Yes -> released, not the offer you signed for. Step 4, financial aid award doesn't make attendance possible (only if you applied for aid)? Yes -> released, most common, the exit schools actually process most. If no to all four -> bound, time to withdraw your other applications. Footnote: a federal antitrust suit, D'Amico v. Consortium on Financing Higher Education, filed August 2025, is testing whether the financial-aid exception protects students in practice, against 32 colleges including Cornell, Duke, and Vanderbilt -- no verdict yet.
Download printable PDFDownload for social (square)

Source: NACAC, Guide to Ethical Practice in College Admission, 2026 Edition; Cornell University; Boston University; Brown Daily Herald; Higher Ed Dive.

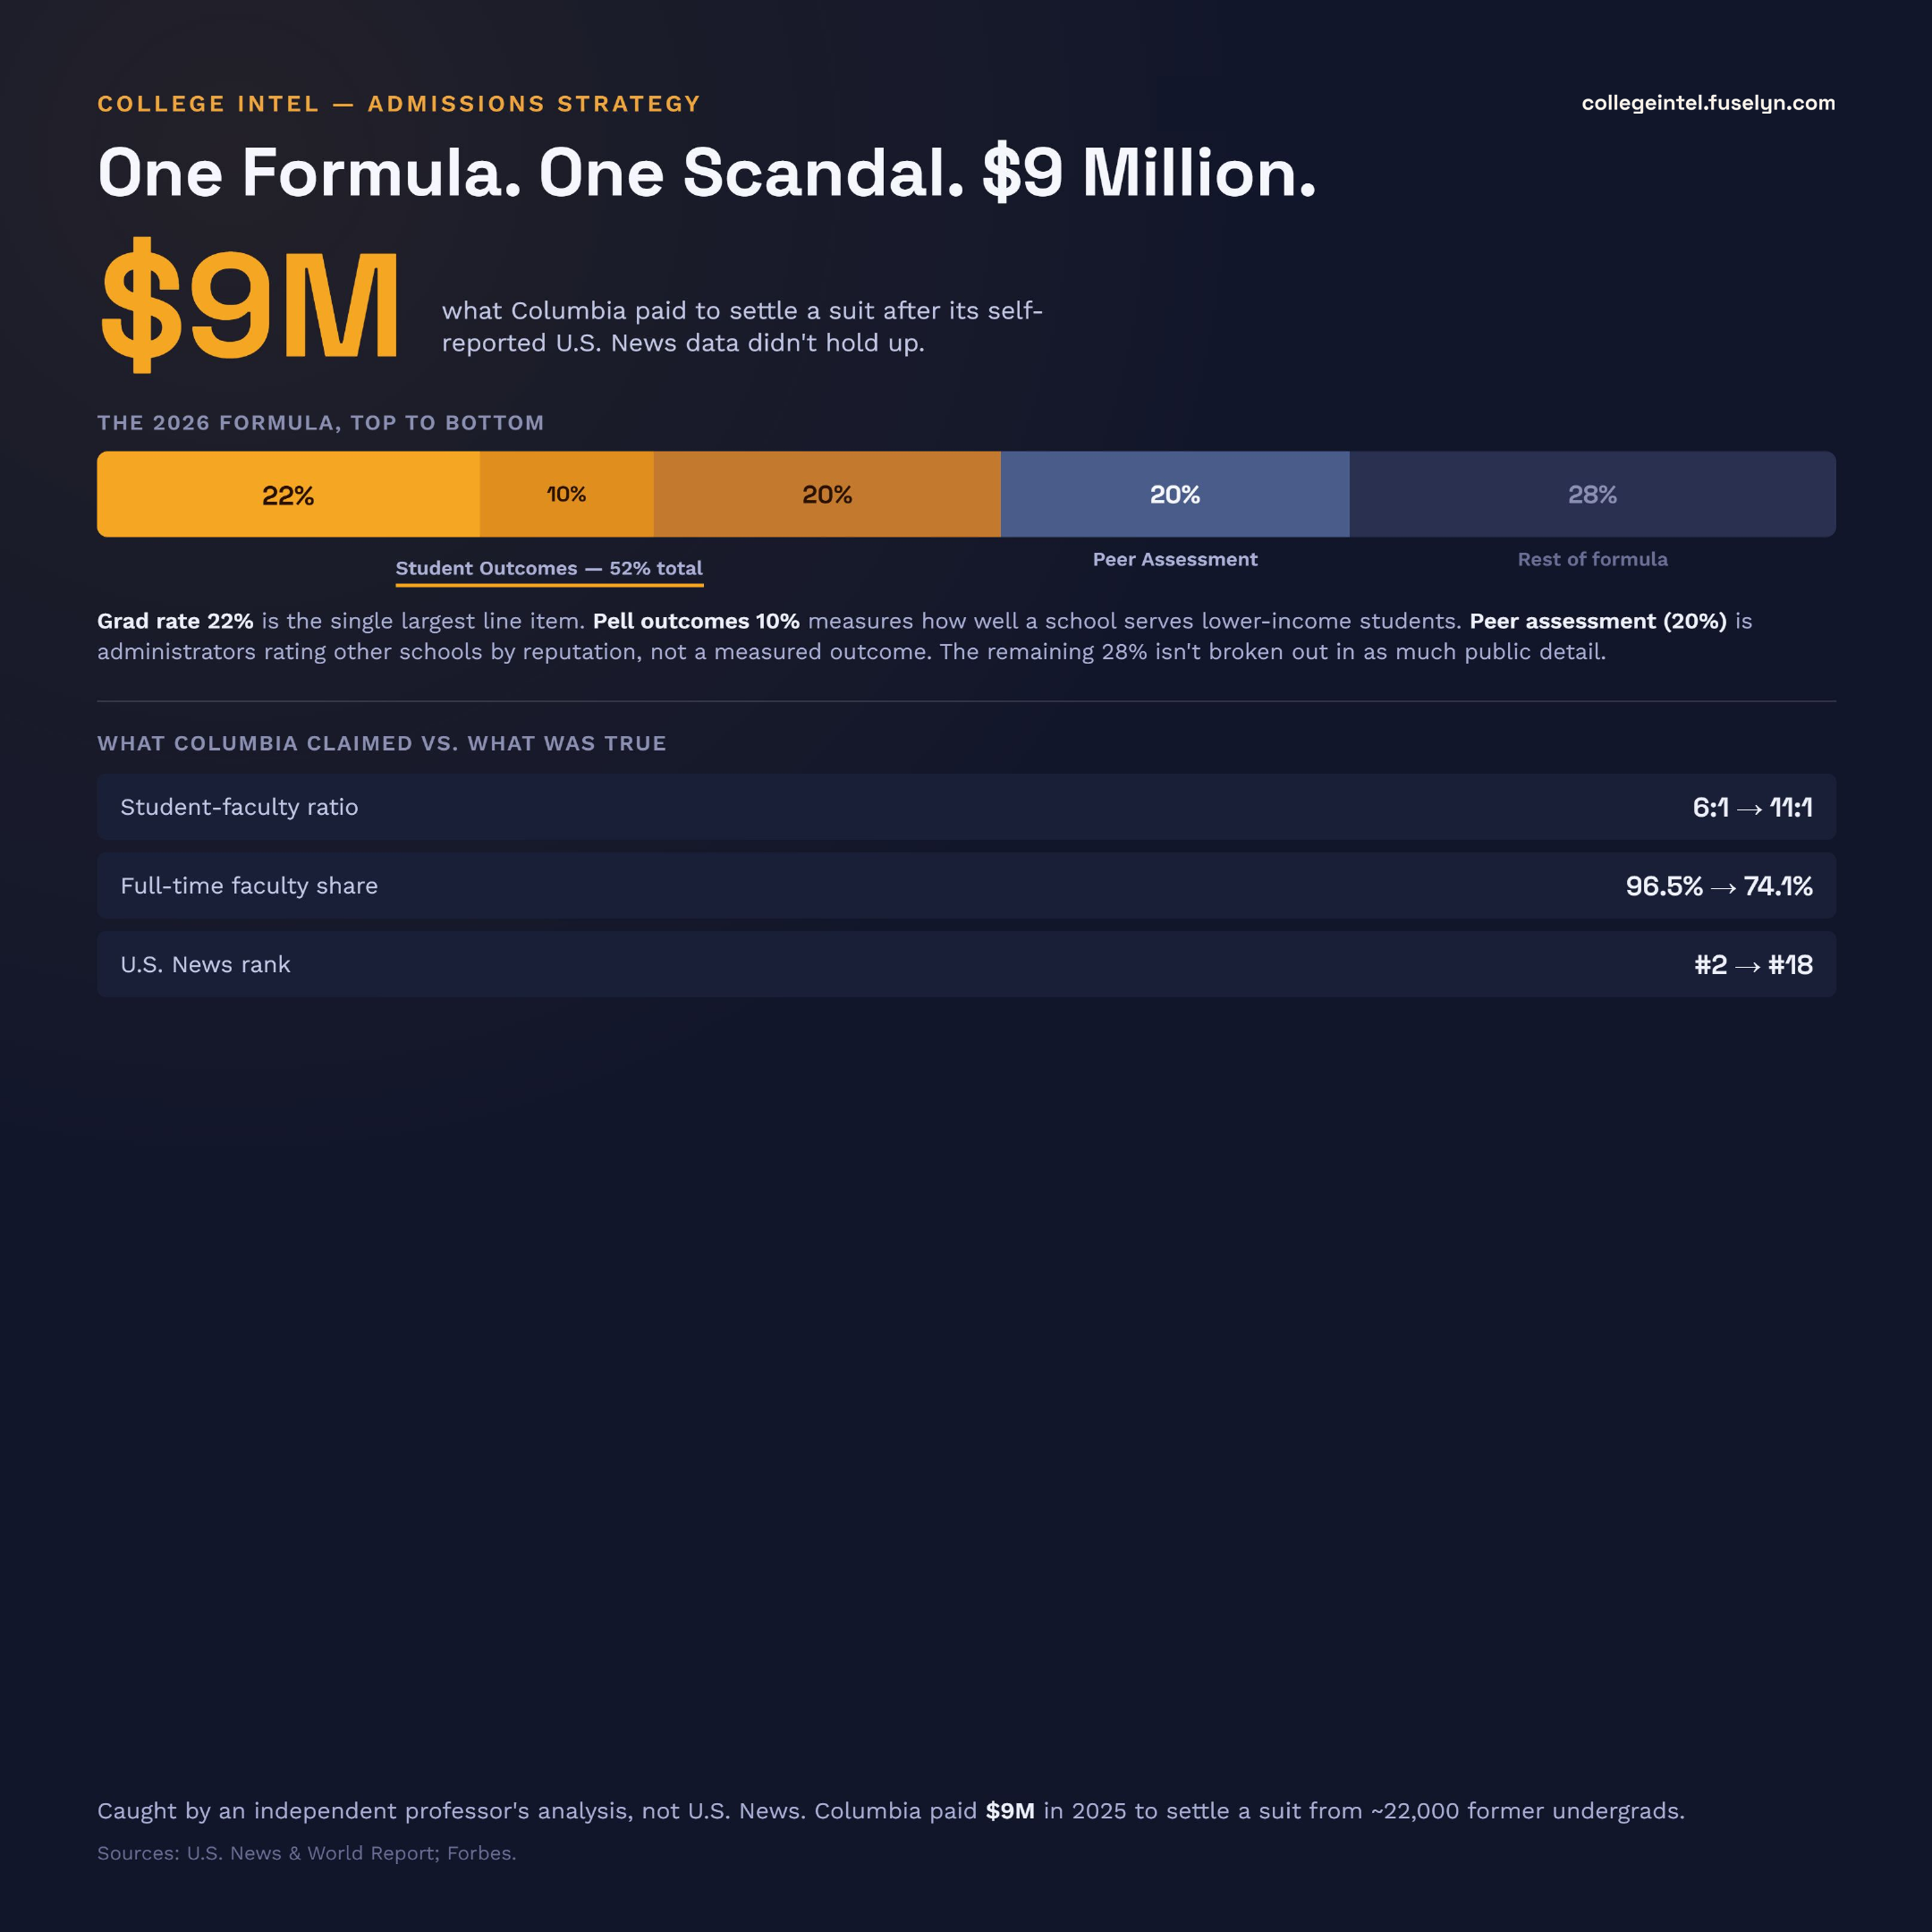
One Formula. One Scandal. $9 Million.

U.S. News's ranking formula is disclosed: 52% is Student Outcomes, 20% is a peer-reputation survey. Columbia claimed a 6:1 student-faculty ratio; an independent analysis found it closer to 11:1 -- the school fell from #2 to #18 and paid $9 million to settle a lawsuit. See the full formula, and the full claimed-vs-actual breakdown, in our full article. Read the full article.
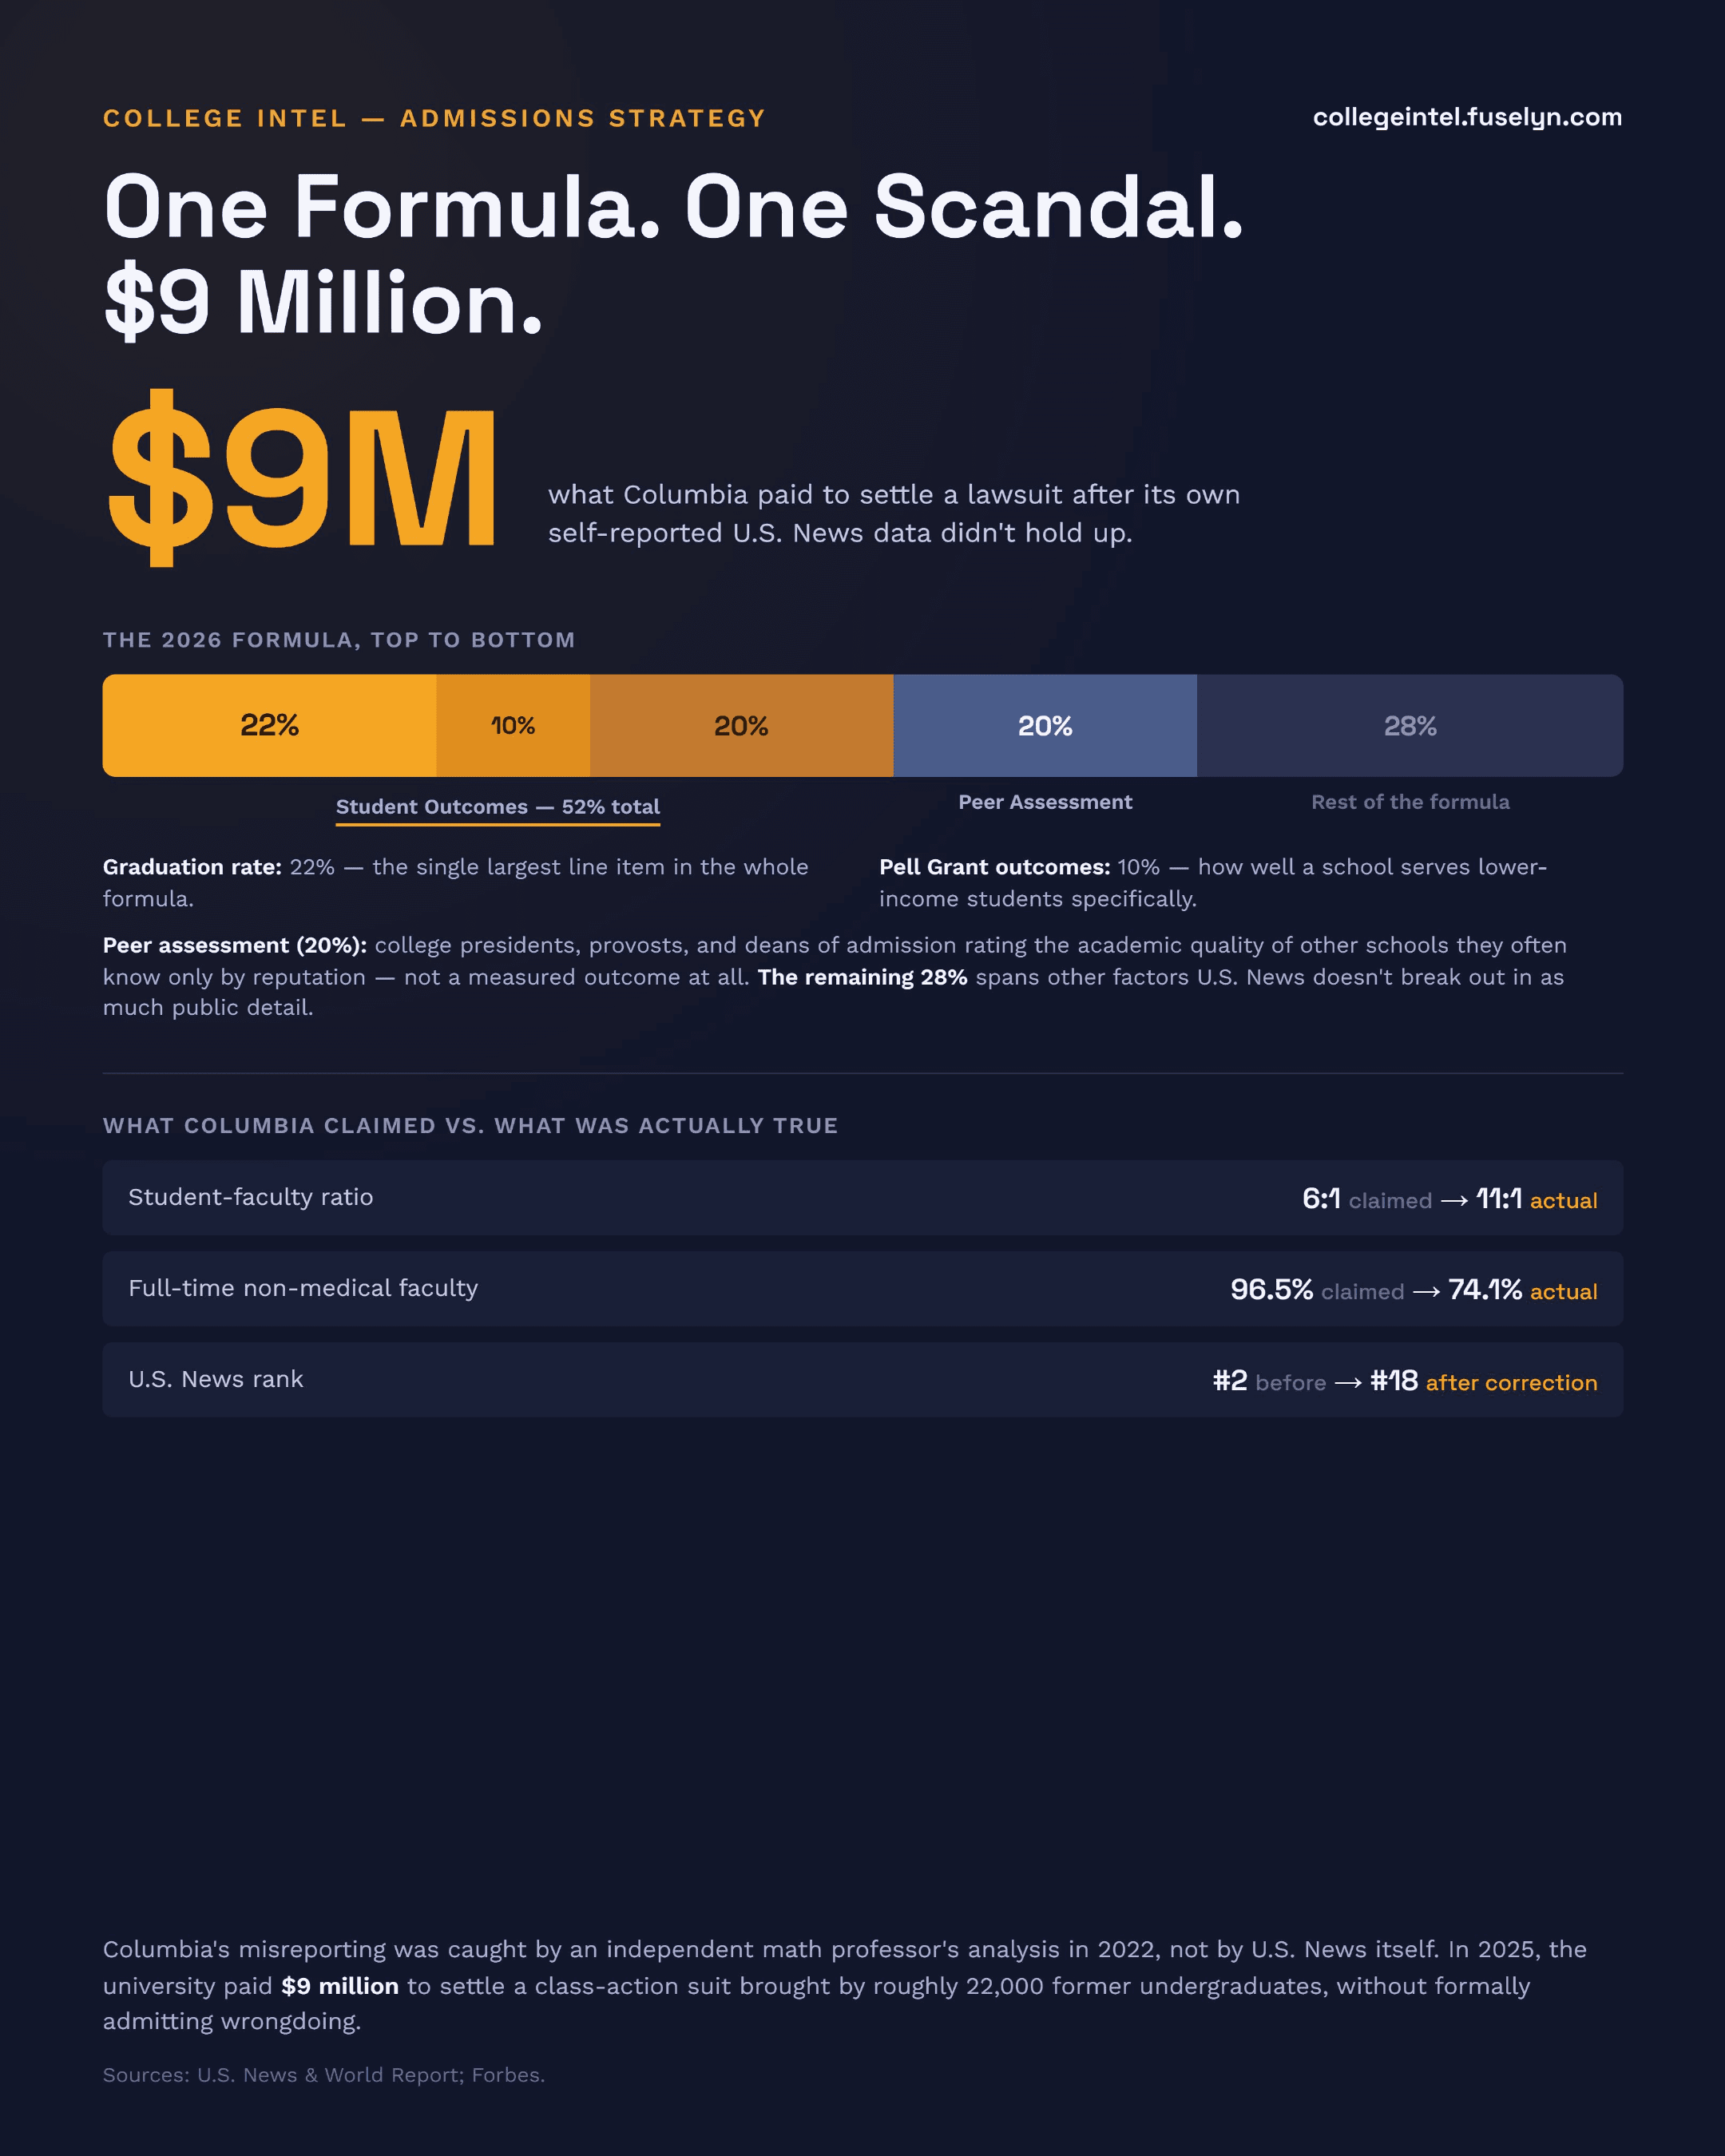
Infographic titled 'One Formula. One Scandal. $9 Million.' $9M -- what Columbia paid to settle a lawsuit after its self-reported U.S. News data didn't hold up. The 2026 formula, top to bottom, as a stacked composition bar: Graduation rate 22%, Pell Grant outcomes 10%, other Student Outcomes measures 20% (Student Outcomes 52% total), Peer Assessment 20%, rest of the formula 28% (not detailed in this analysis). What Columbia claimed vs. what was actually true: student-faculty ratio 6:1 claimed vs 11:1 actual; full-time non-medical faculty 96.5% claimed vs 74.1% actual; U.S. News rank #2 before vs #18 after correction. Footnote: caught by an independent math professor's analysis in 2022, not U.S. News; Columbia paid $9 million in 2025 to settle a suit from roughly 22,000 former undergraduates.
Download printable PDFDownload for social (square)

Sources: U.S. News & World Report; Forbes.

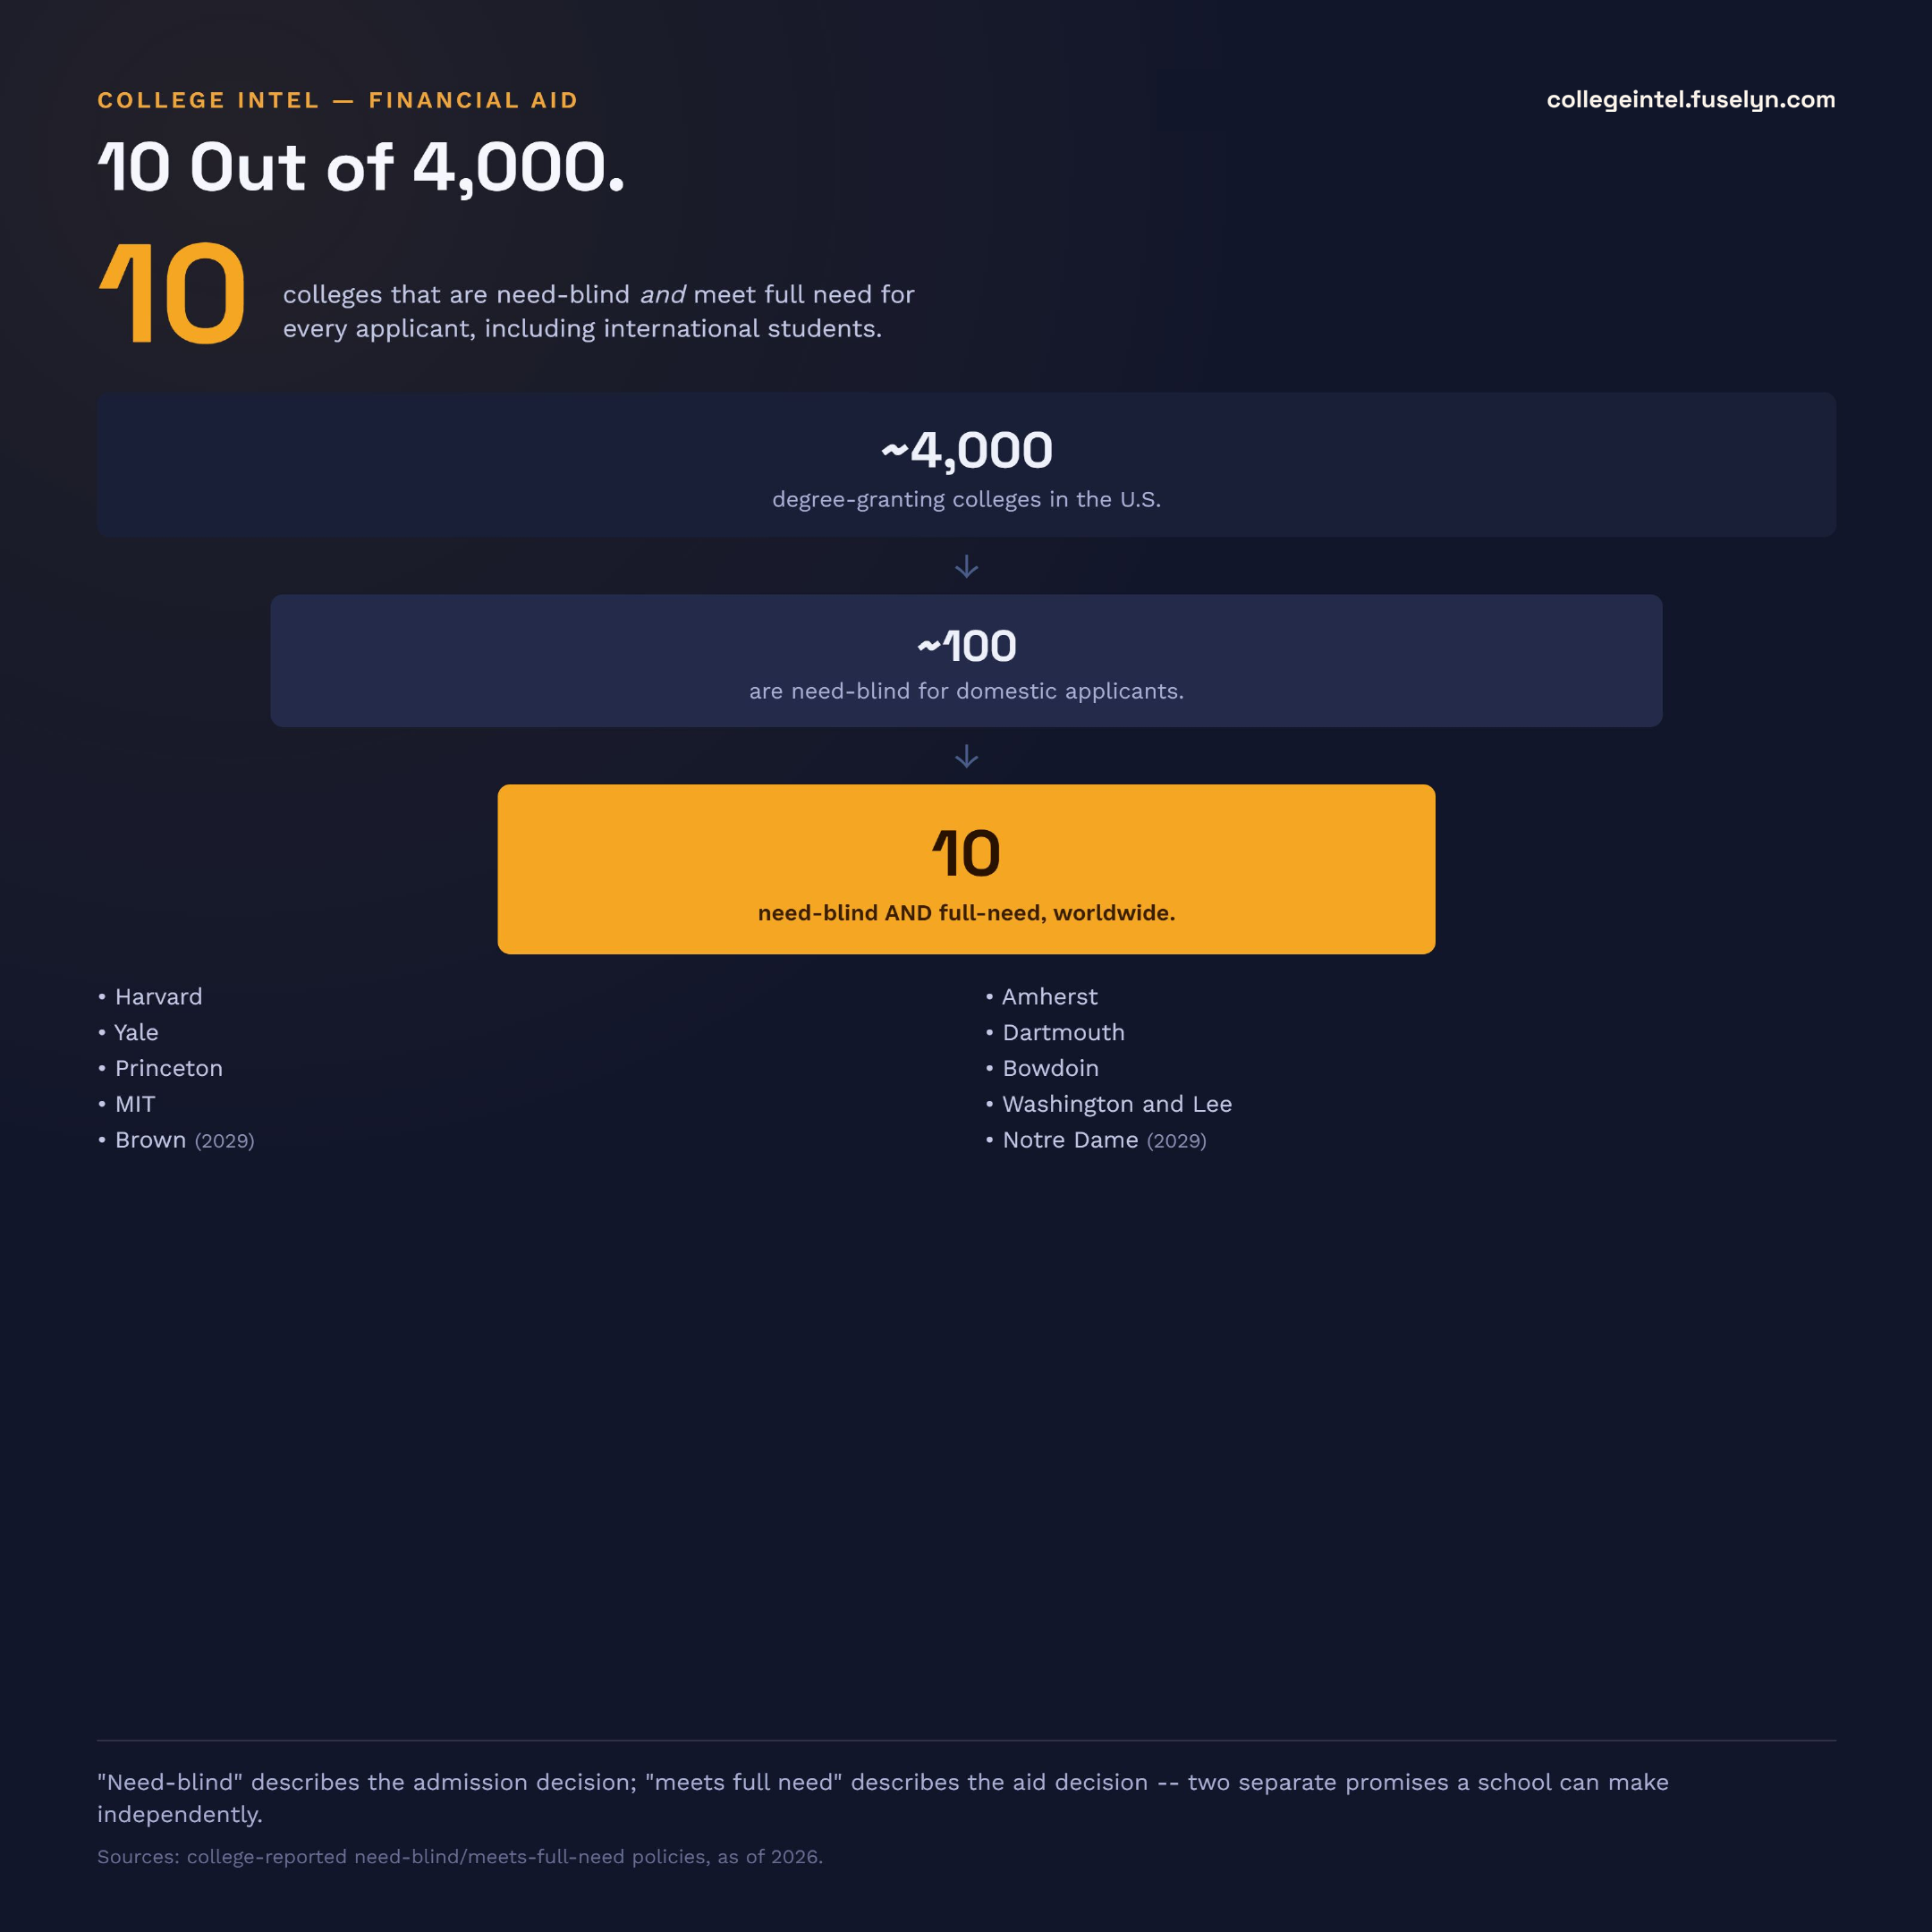
10 Out of 4,000.

Only about 100 U.S. colleges are need-blind in admission -- and just 10 of those also meet full demonstrated need for every applicant, including international students. See what "need-blind" actually promises (and doesn't), and whether private can really be cheaper than public, in our full article. Read the full article.
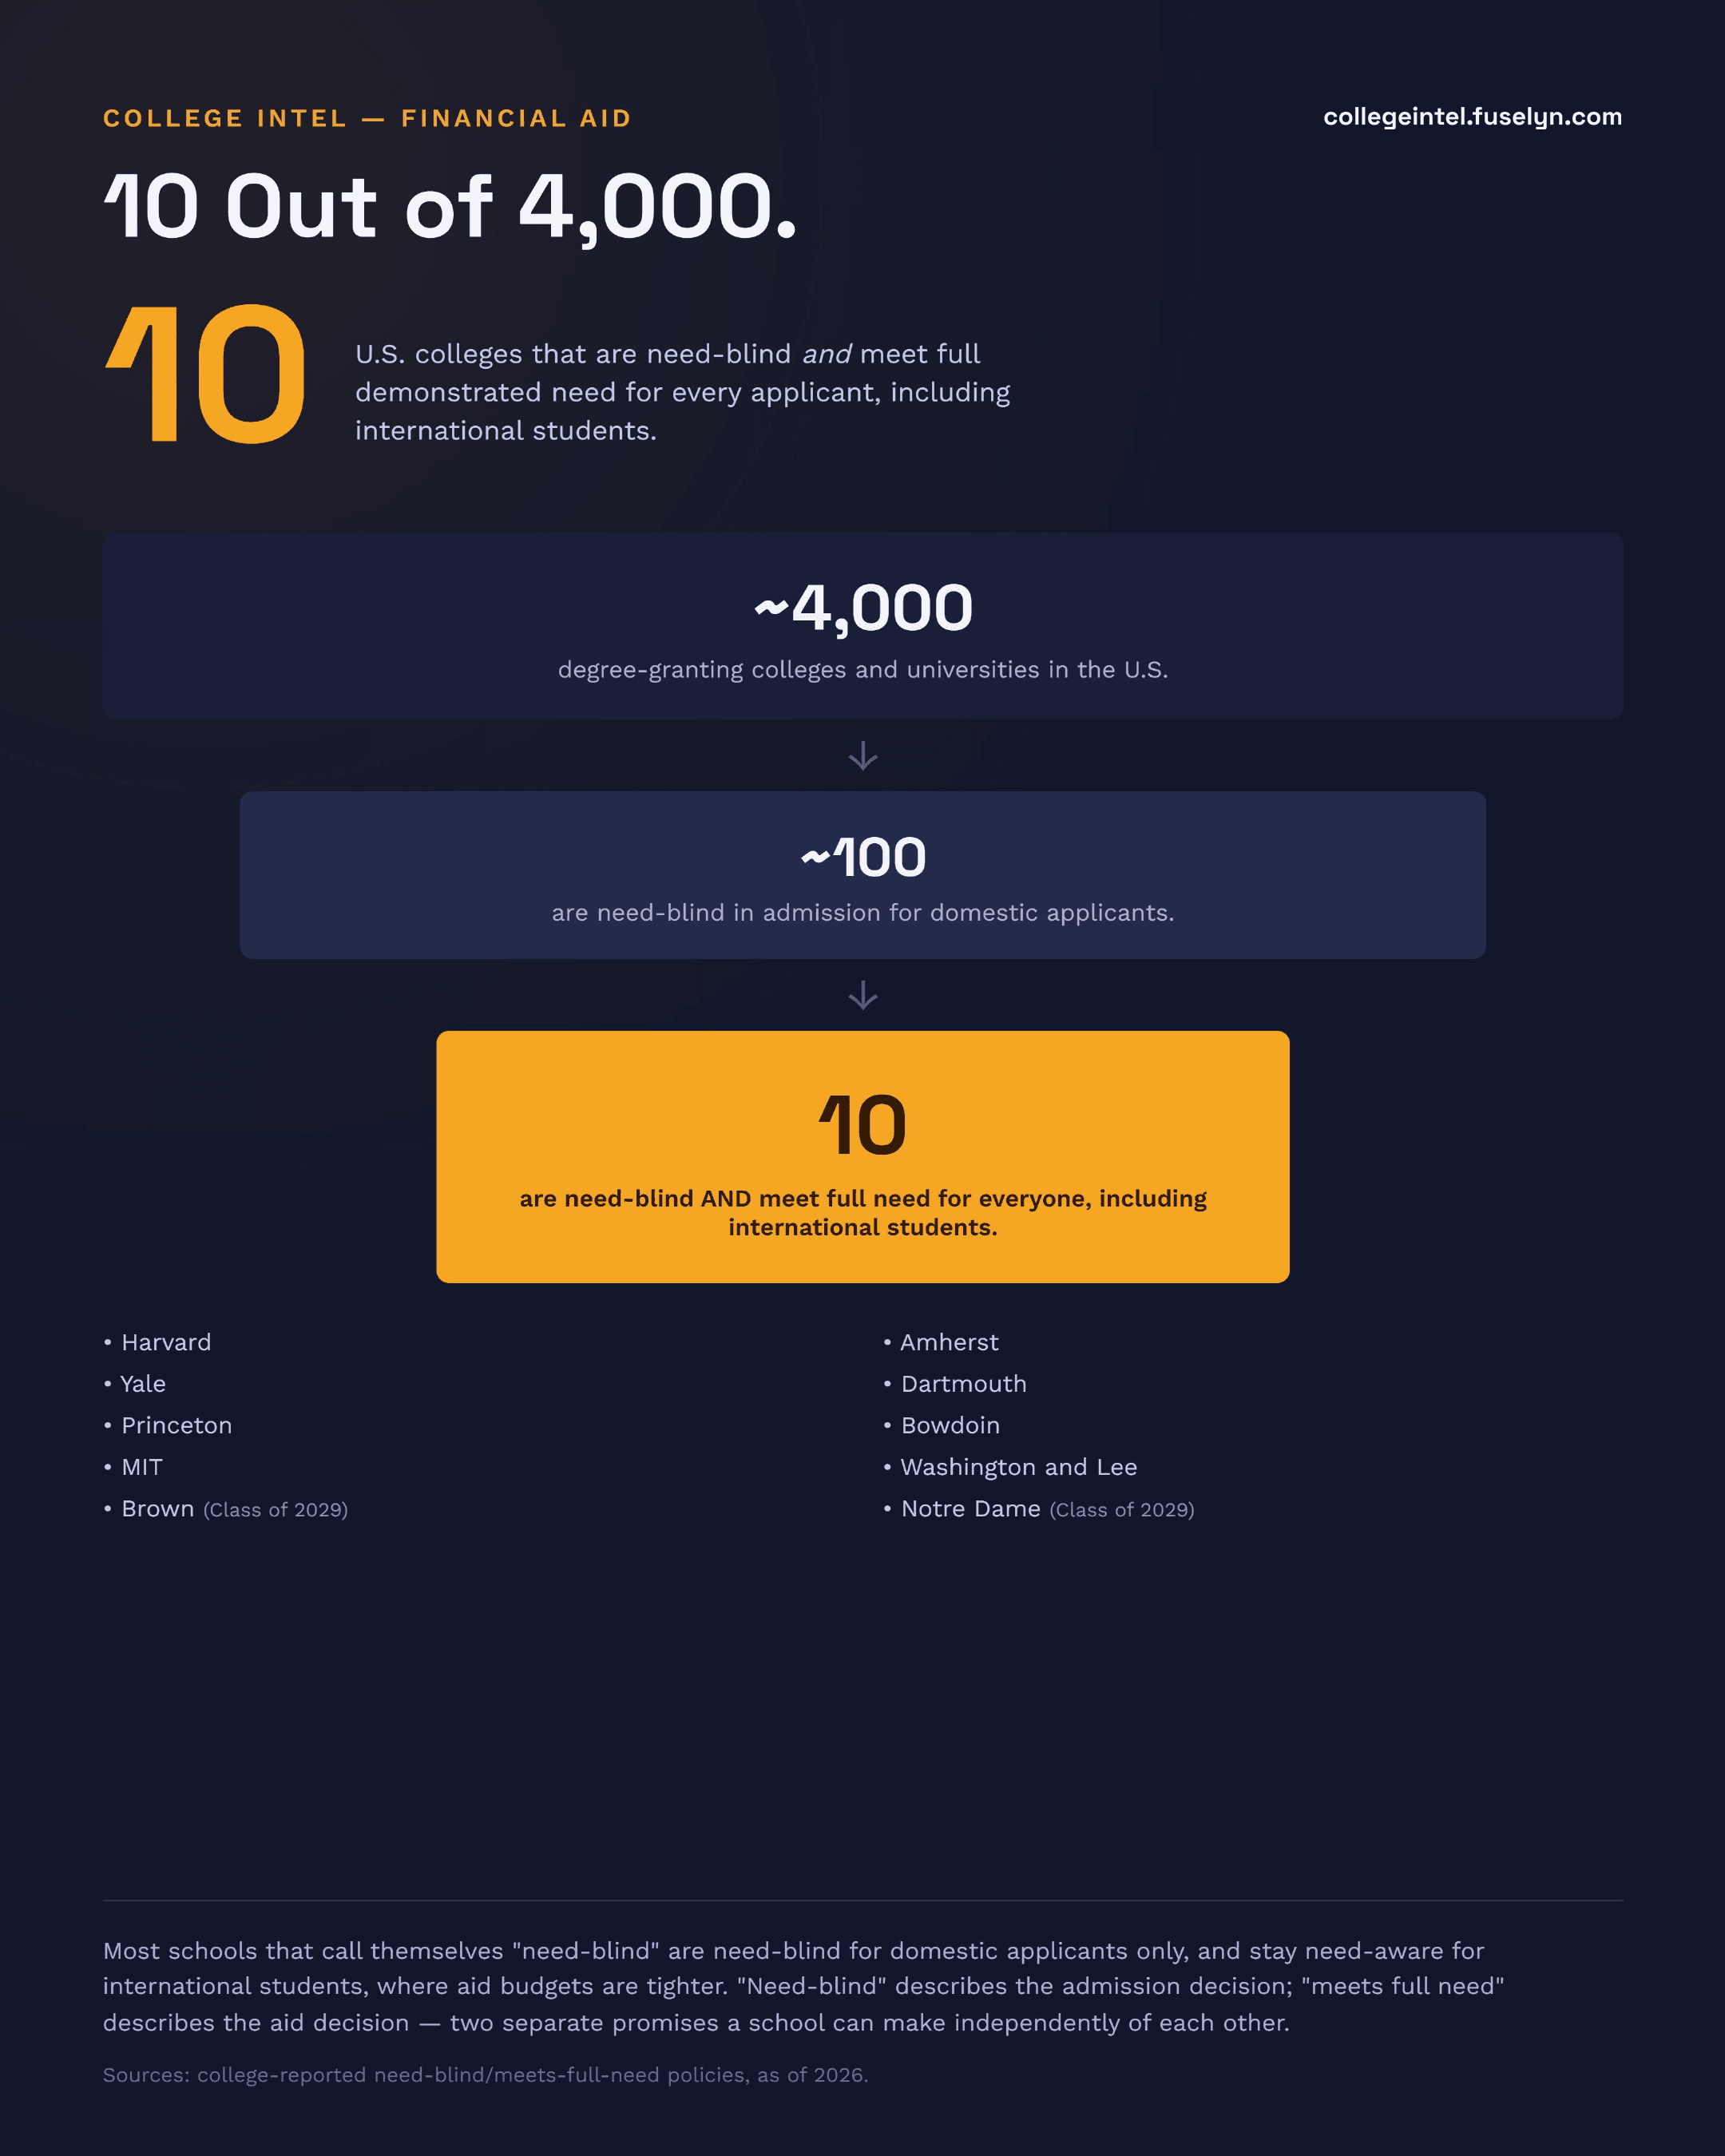
Infographic titled '10 Out of 4,000.' 10 -- U.S. colleges that are need-blind and meet full demonstrated need for every applicant, including international students. Funnel: approximately 4,000 degree-granting colleges and universities in the U.S., narrowing to approximately 100 that are need-blind in admission for domestic applicants, narrowing to 10 that are need-blind and meet full need for everyone including international students: Harvard, Yale, Princeton, MIT, Amherst, Dartmouth, Bowdoin, Washington and Lee, and (starting with the Class of 2029) Brown and Notre Dame. Footnote: 'need-blind' describes the admission decision; 'meets full need' describes the aid decision -- two separate promises a school can make independently of each other.
Download printable PDFDownload for social (square)

Sources: college-reported need-blind/meets-full-need policies, as of 2026.

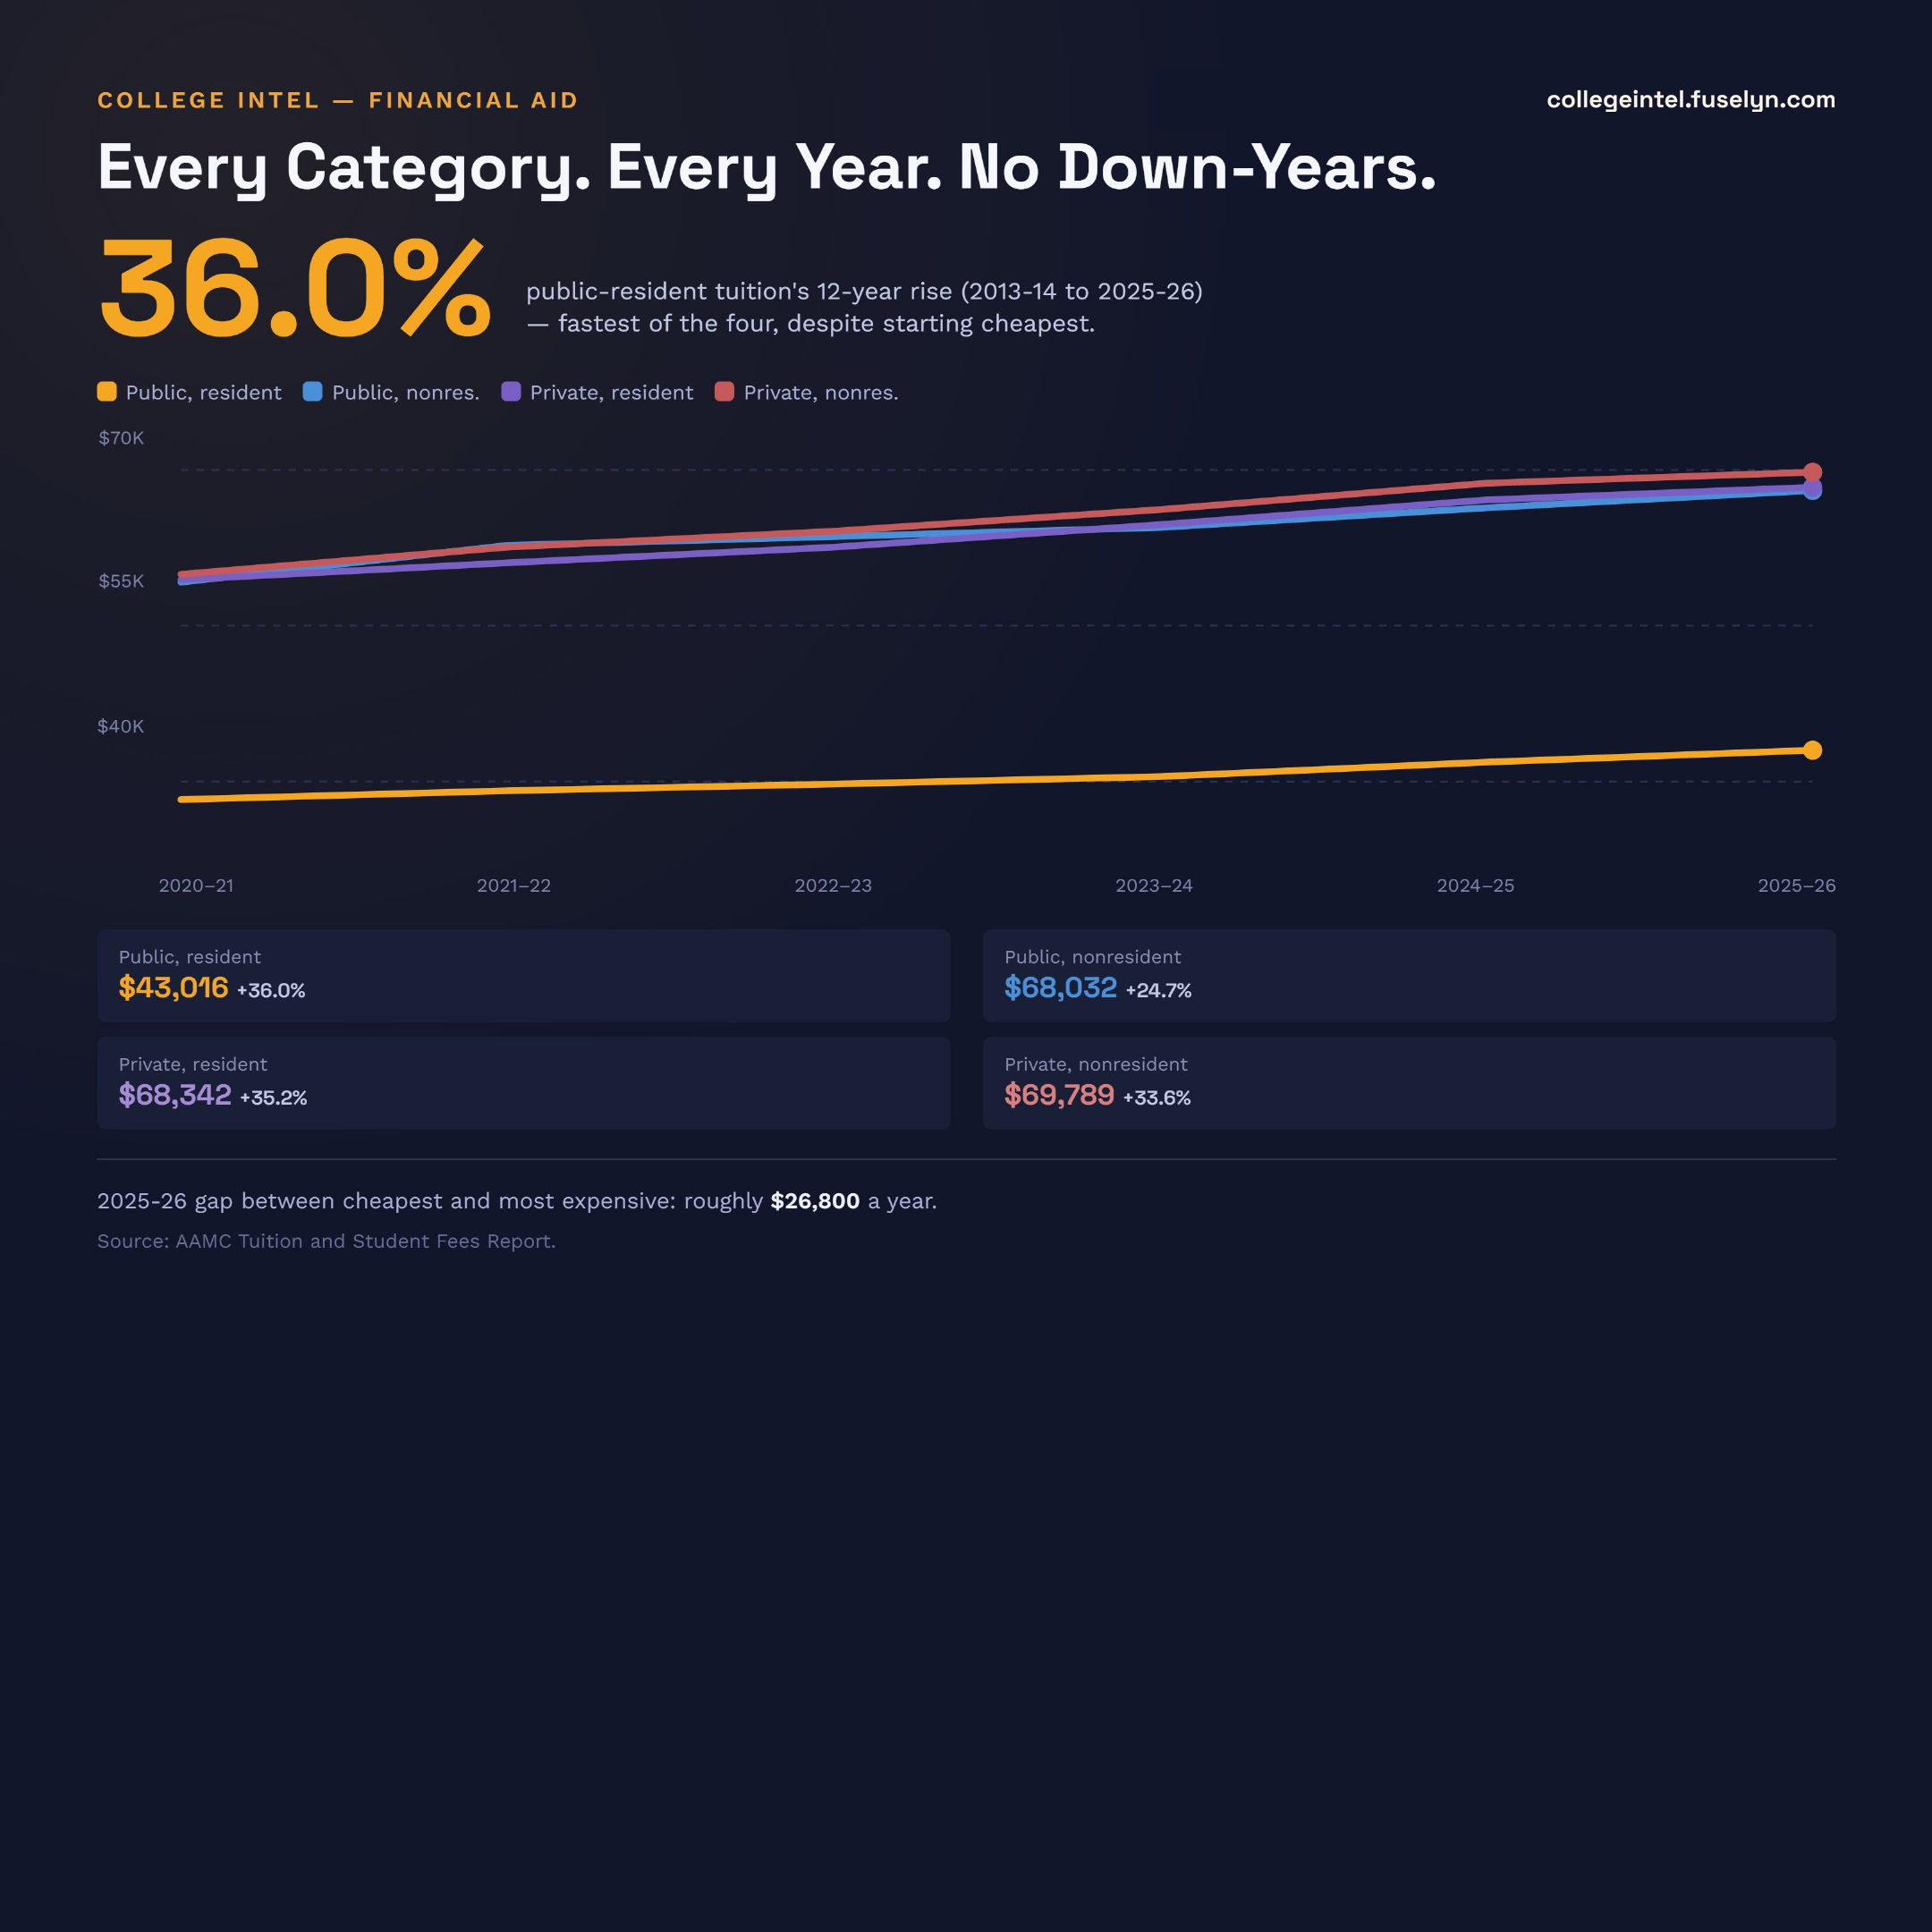
Every Category. Every Year. No Down-Years.

AAMC's own tuition survey shows public-resident medical school tuition up 36.0% over 12 years -- the fastest-rising of four cost categories, despite starting (and staying) the cheapest. See the full year-by-year trend, and the real 2025-26 dollar gap between categories, in our full article. Read the full article.
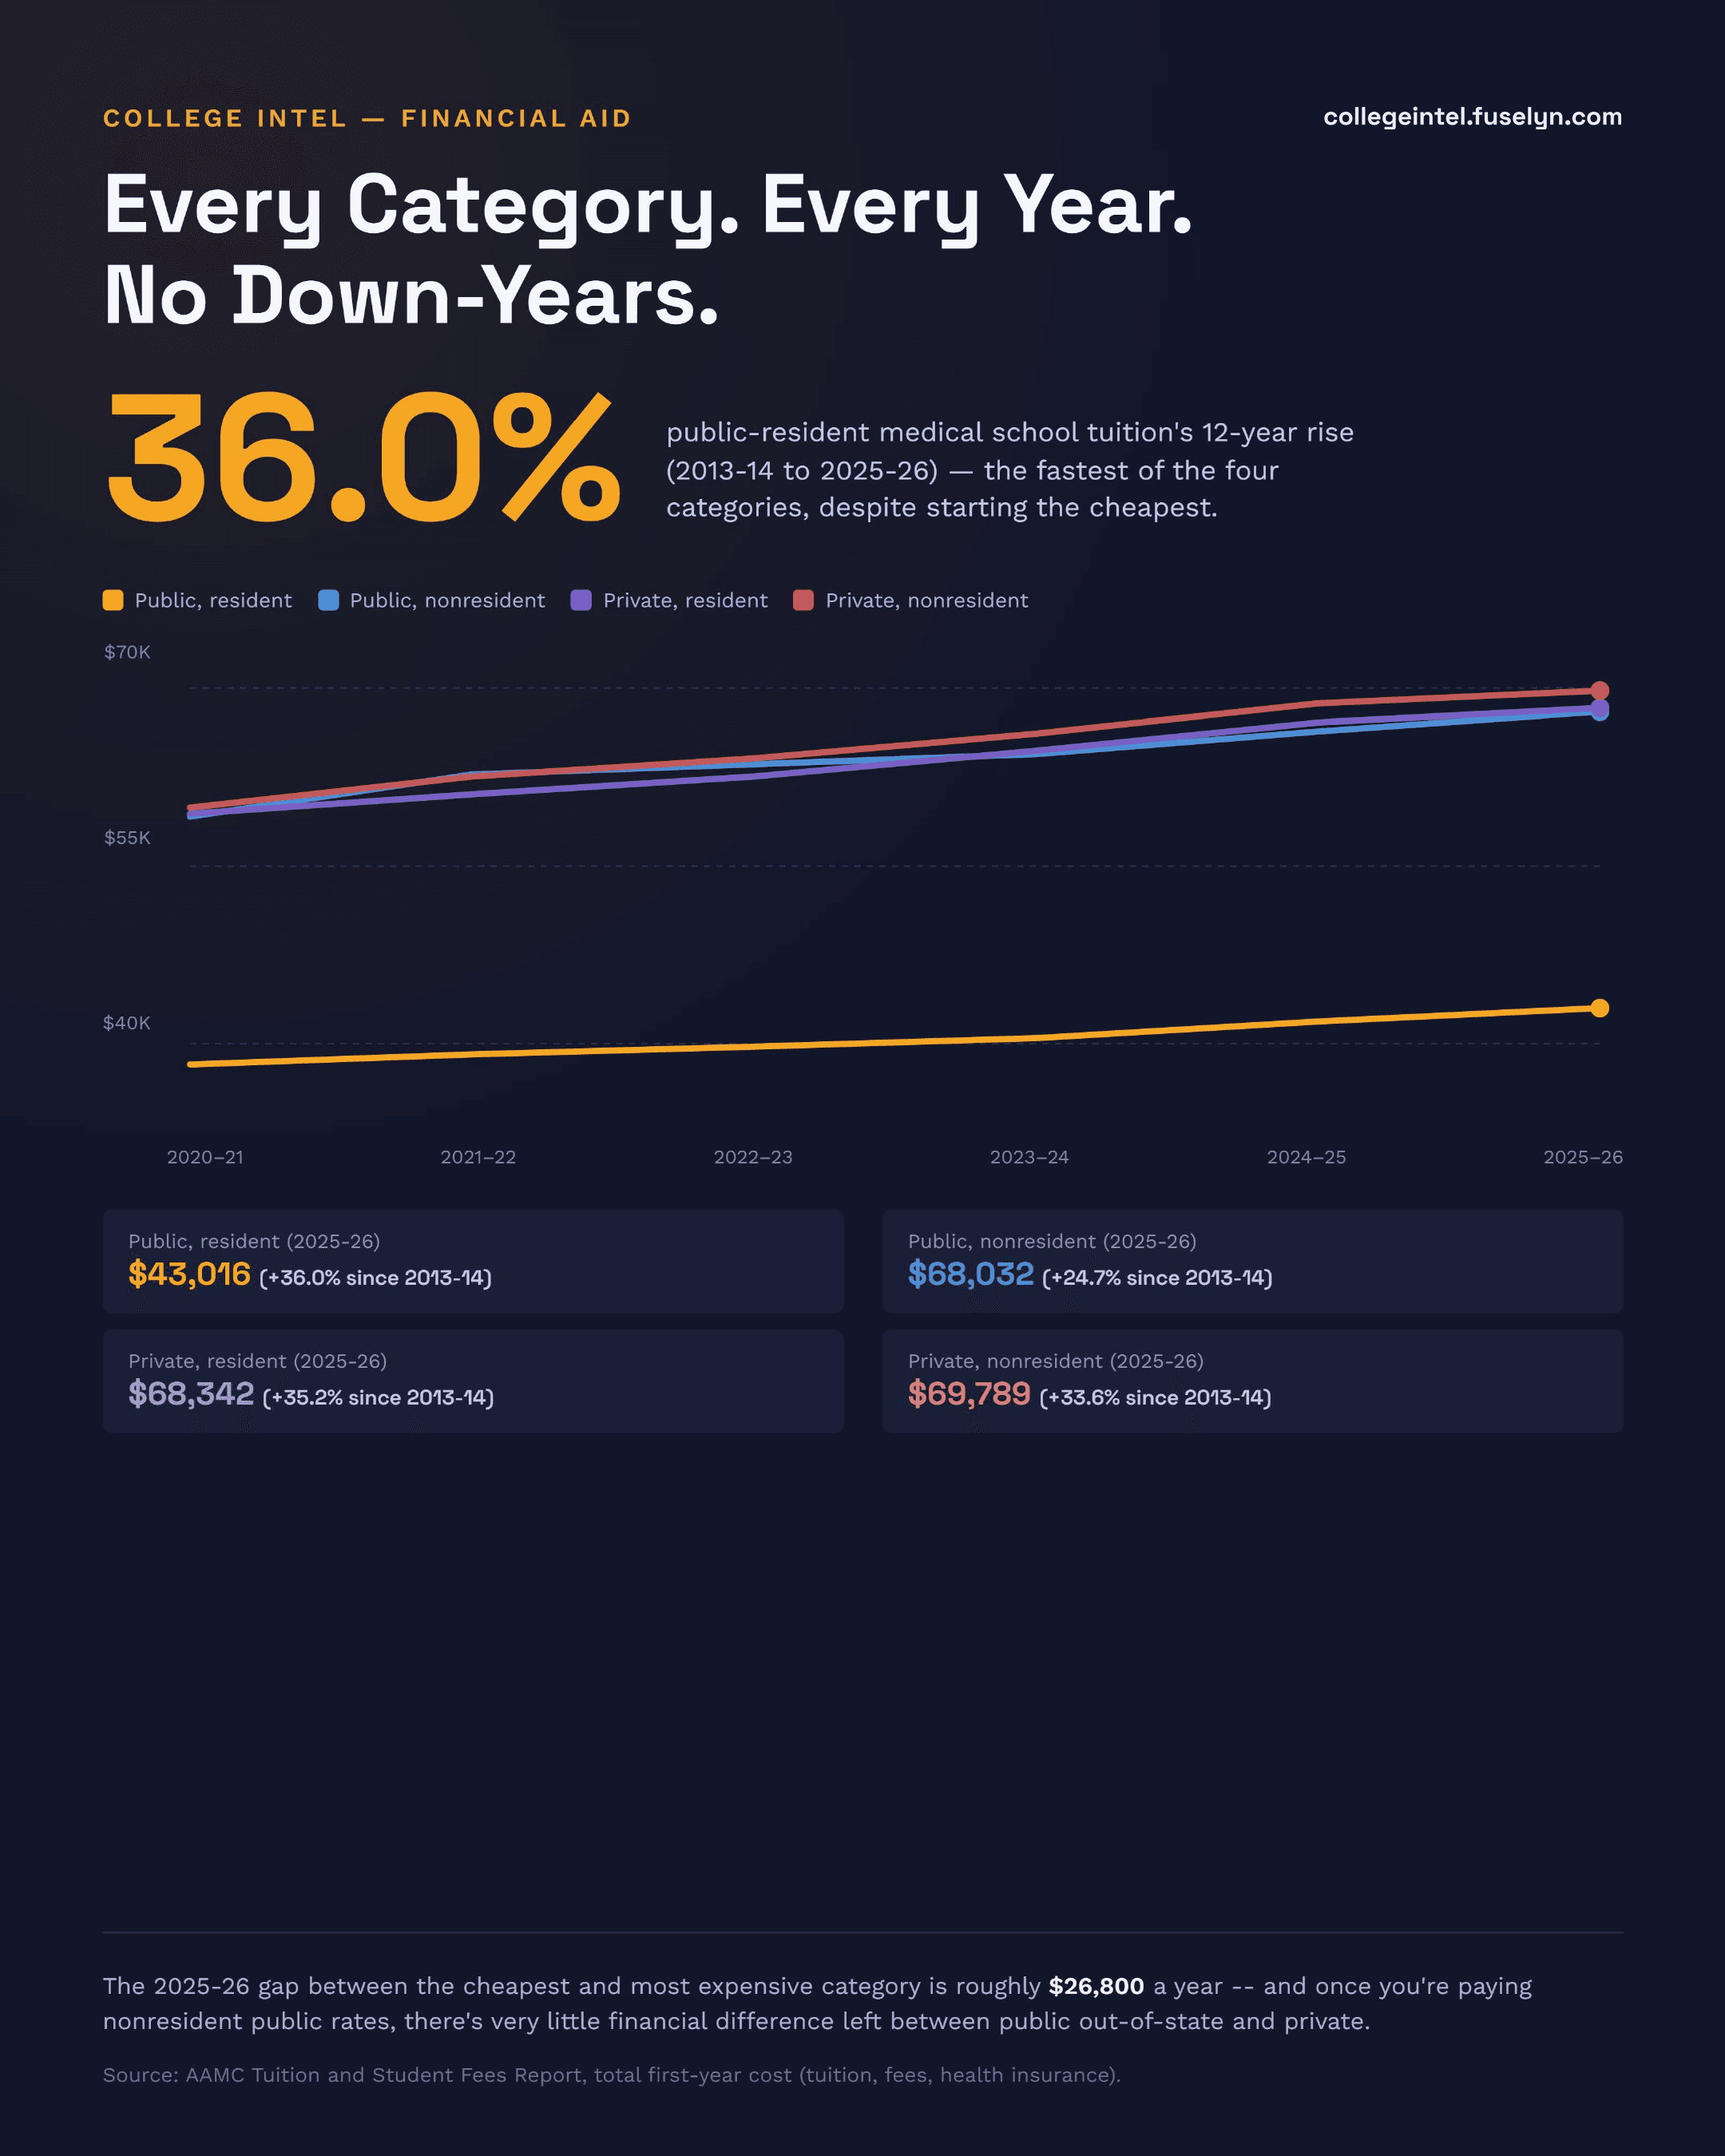
Infographic titled 'Every Category. Every Year. No Down-Years.' 36.0% -- public-resident medical school tuition's 12-year rise (2013-14 to 2025-26), the fastest of four categories despite starting cheapest. Line chart, 2020-21 through 2025-26, four series climbing every year with no down-years: Public resident $38,253 to $43,016; Public nonresident $59,174 to $68,032; Private resident $59,423 to $68,342; Private nonresident $59,942 to $69,789. 12-year rises since 2013-14: Public resident +36.0%, Private resident +35.2%, Private nonresident +33.6%, Public nonresident +24.7%. Footnote: the 2025-26 gap between the cheapest and most expensive category is roughly $26,800 a year.
Download printable PDFDownload for social (square)

Source: AAMC Tuition and Student Fees Report, total first-year cost (tuition, fees, health insurance).

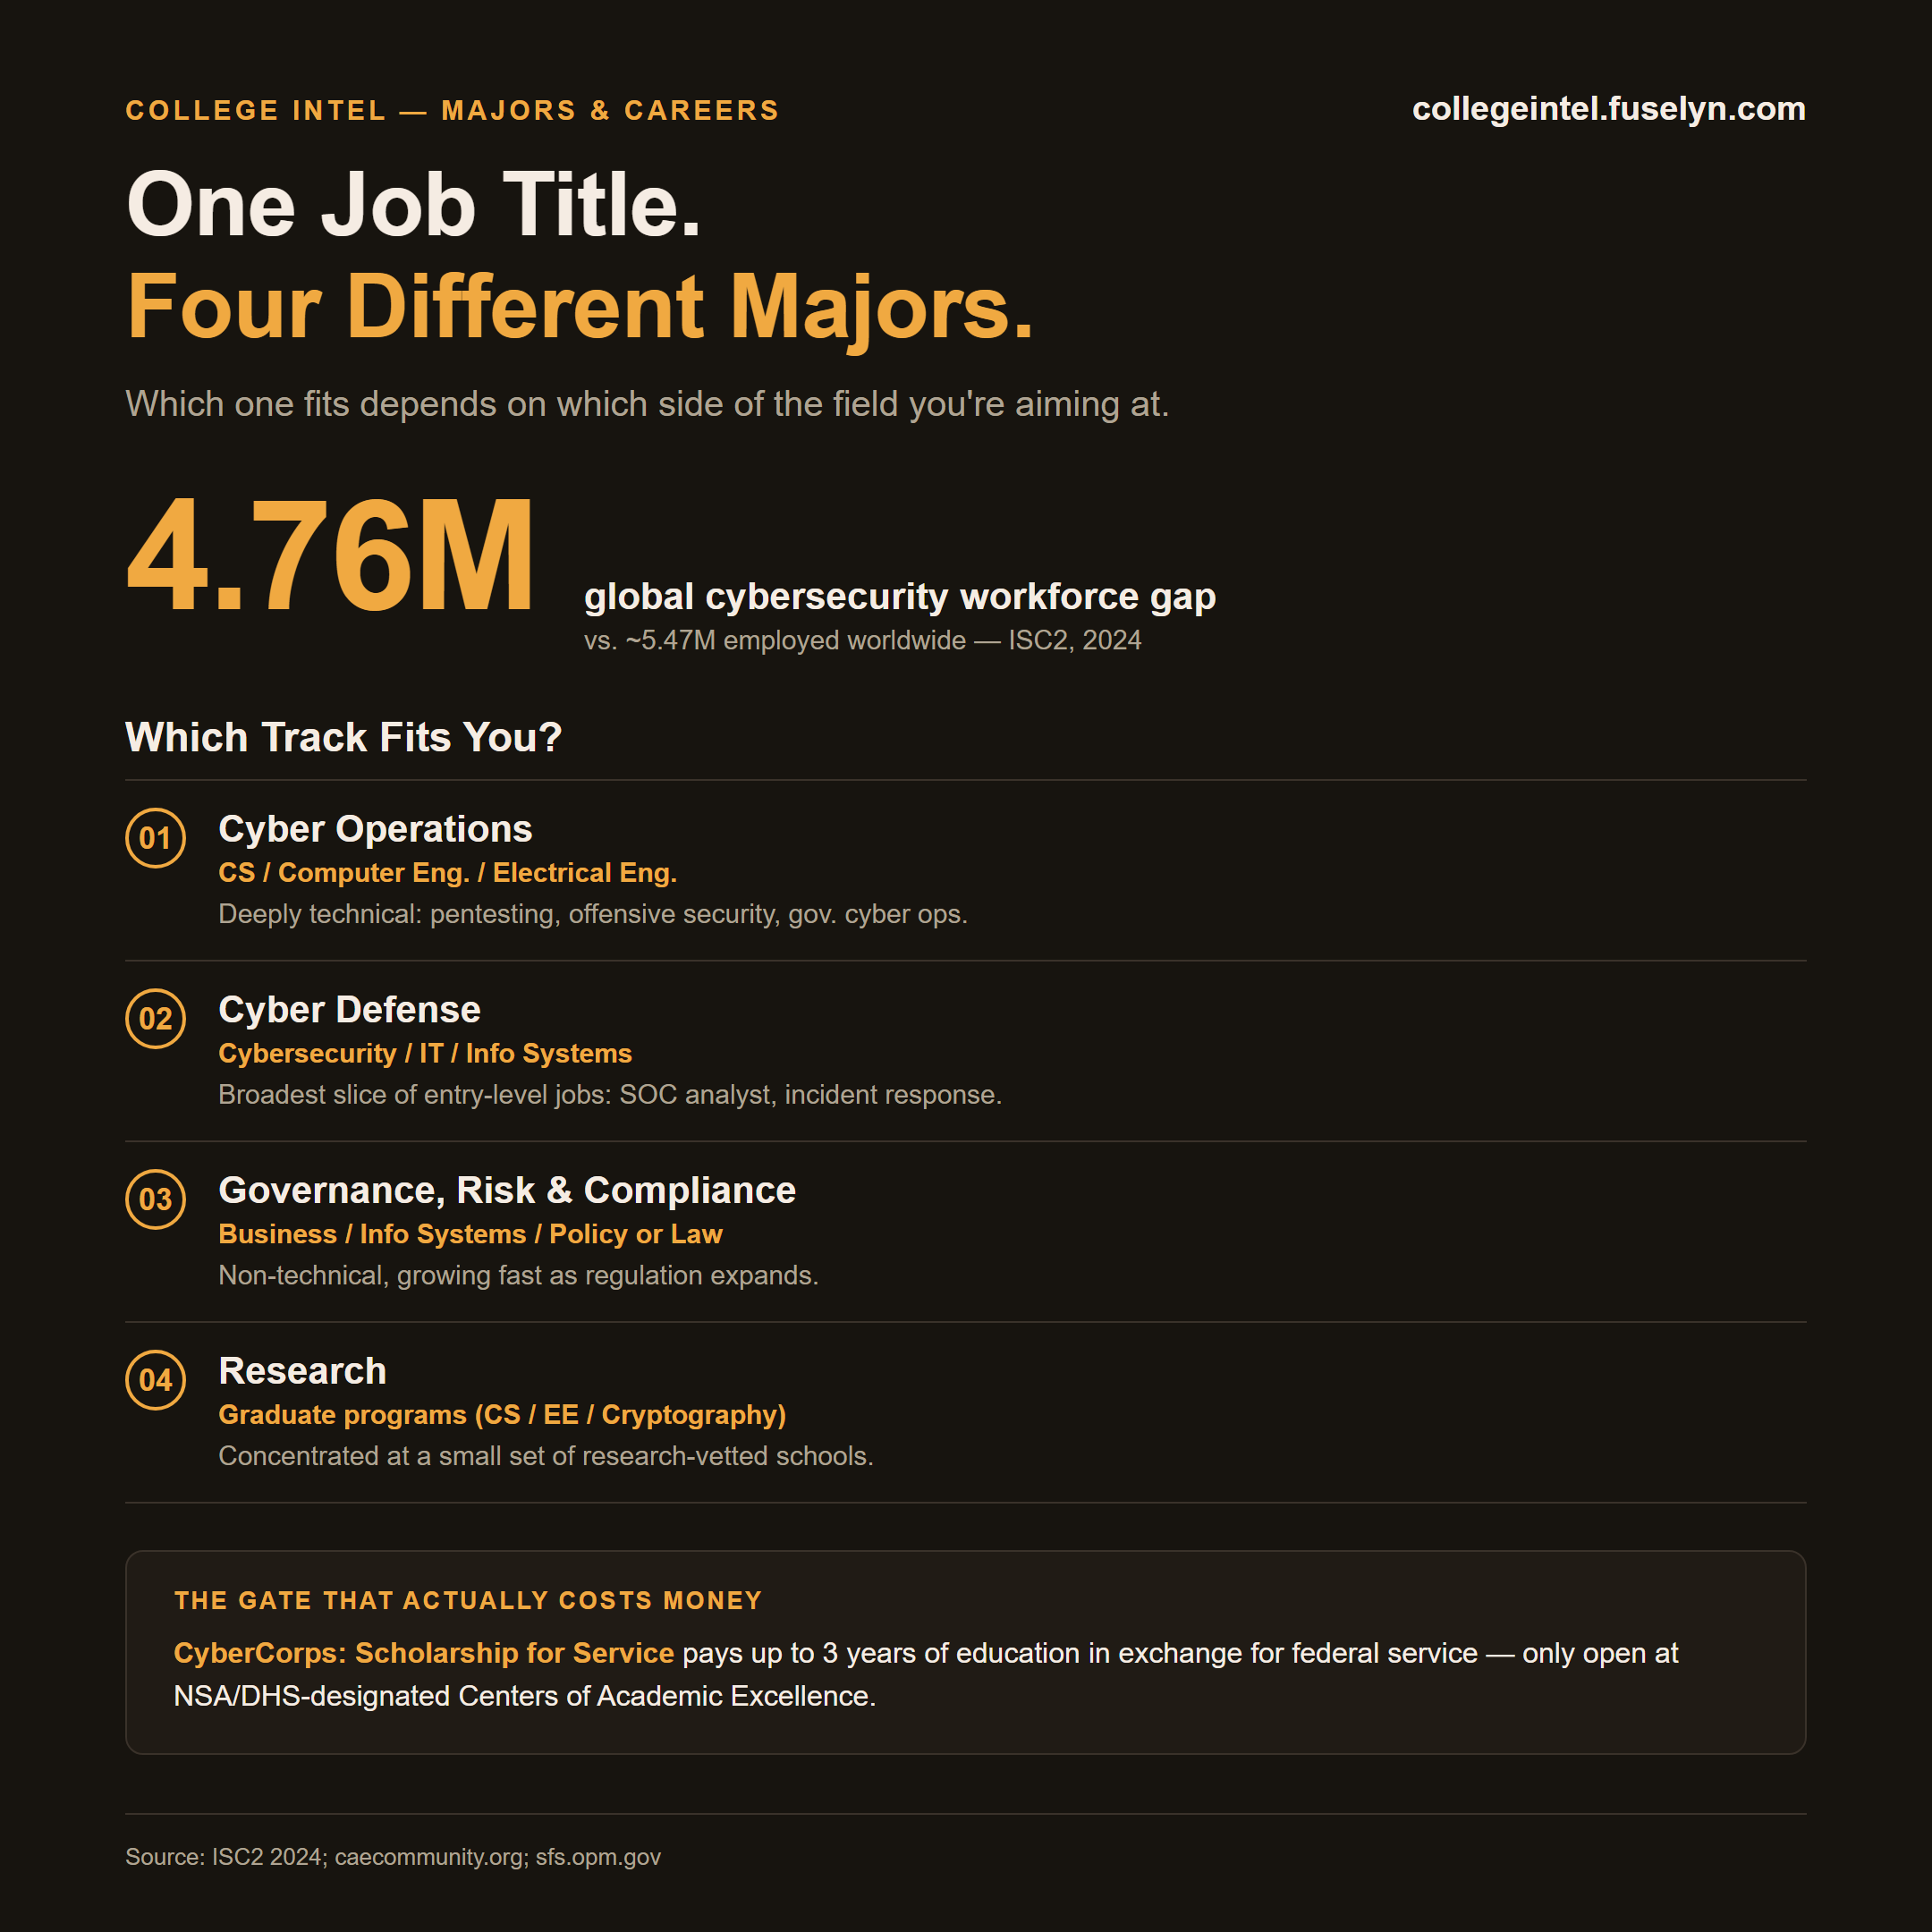
One Job Title. Four Different Majors.

ISC2's own 2024 workforce study puts the global cybersecurity gap at 4.76 million people -- but there's no single accredited 'cybersecurity major.' See the four real tracks, and the federal scholarship gated behind one specific designation, in our full article. Read the full article.
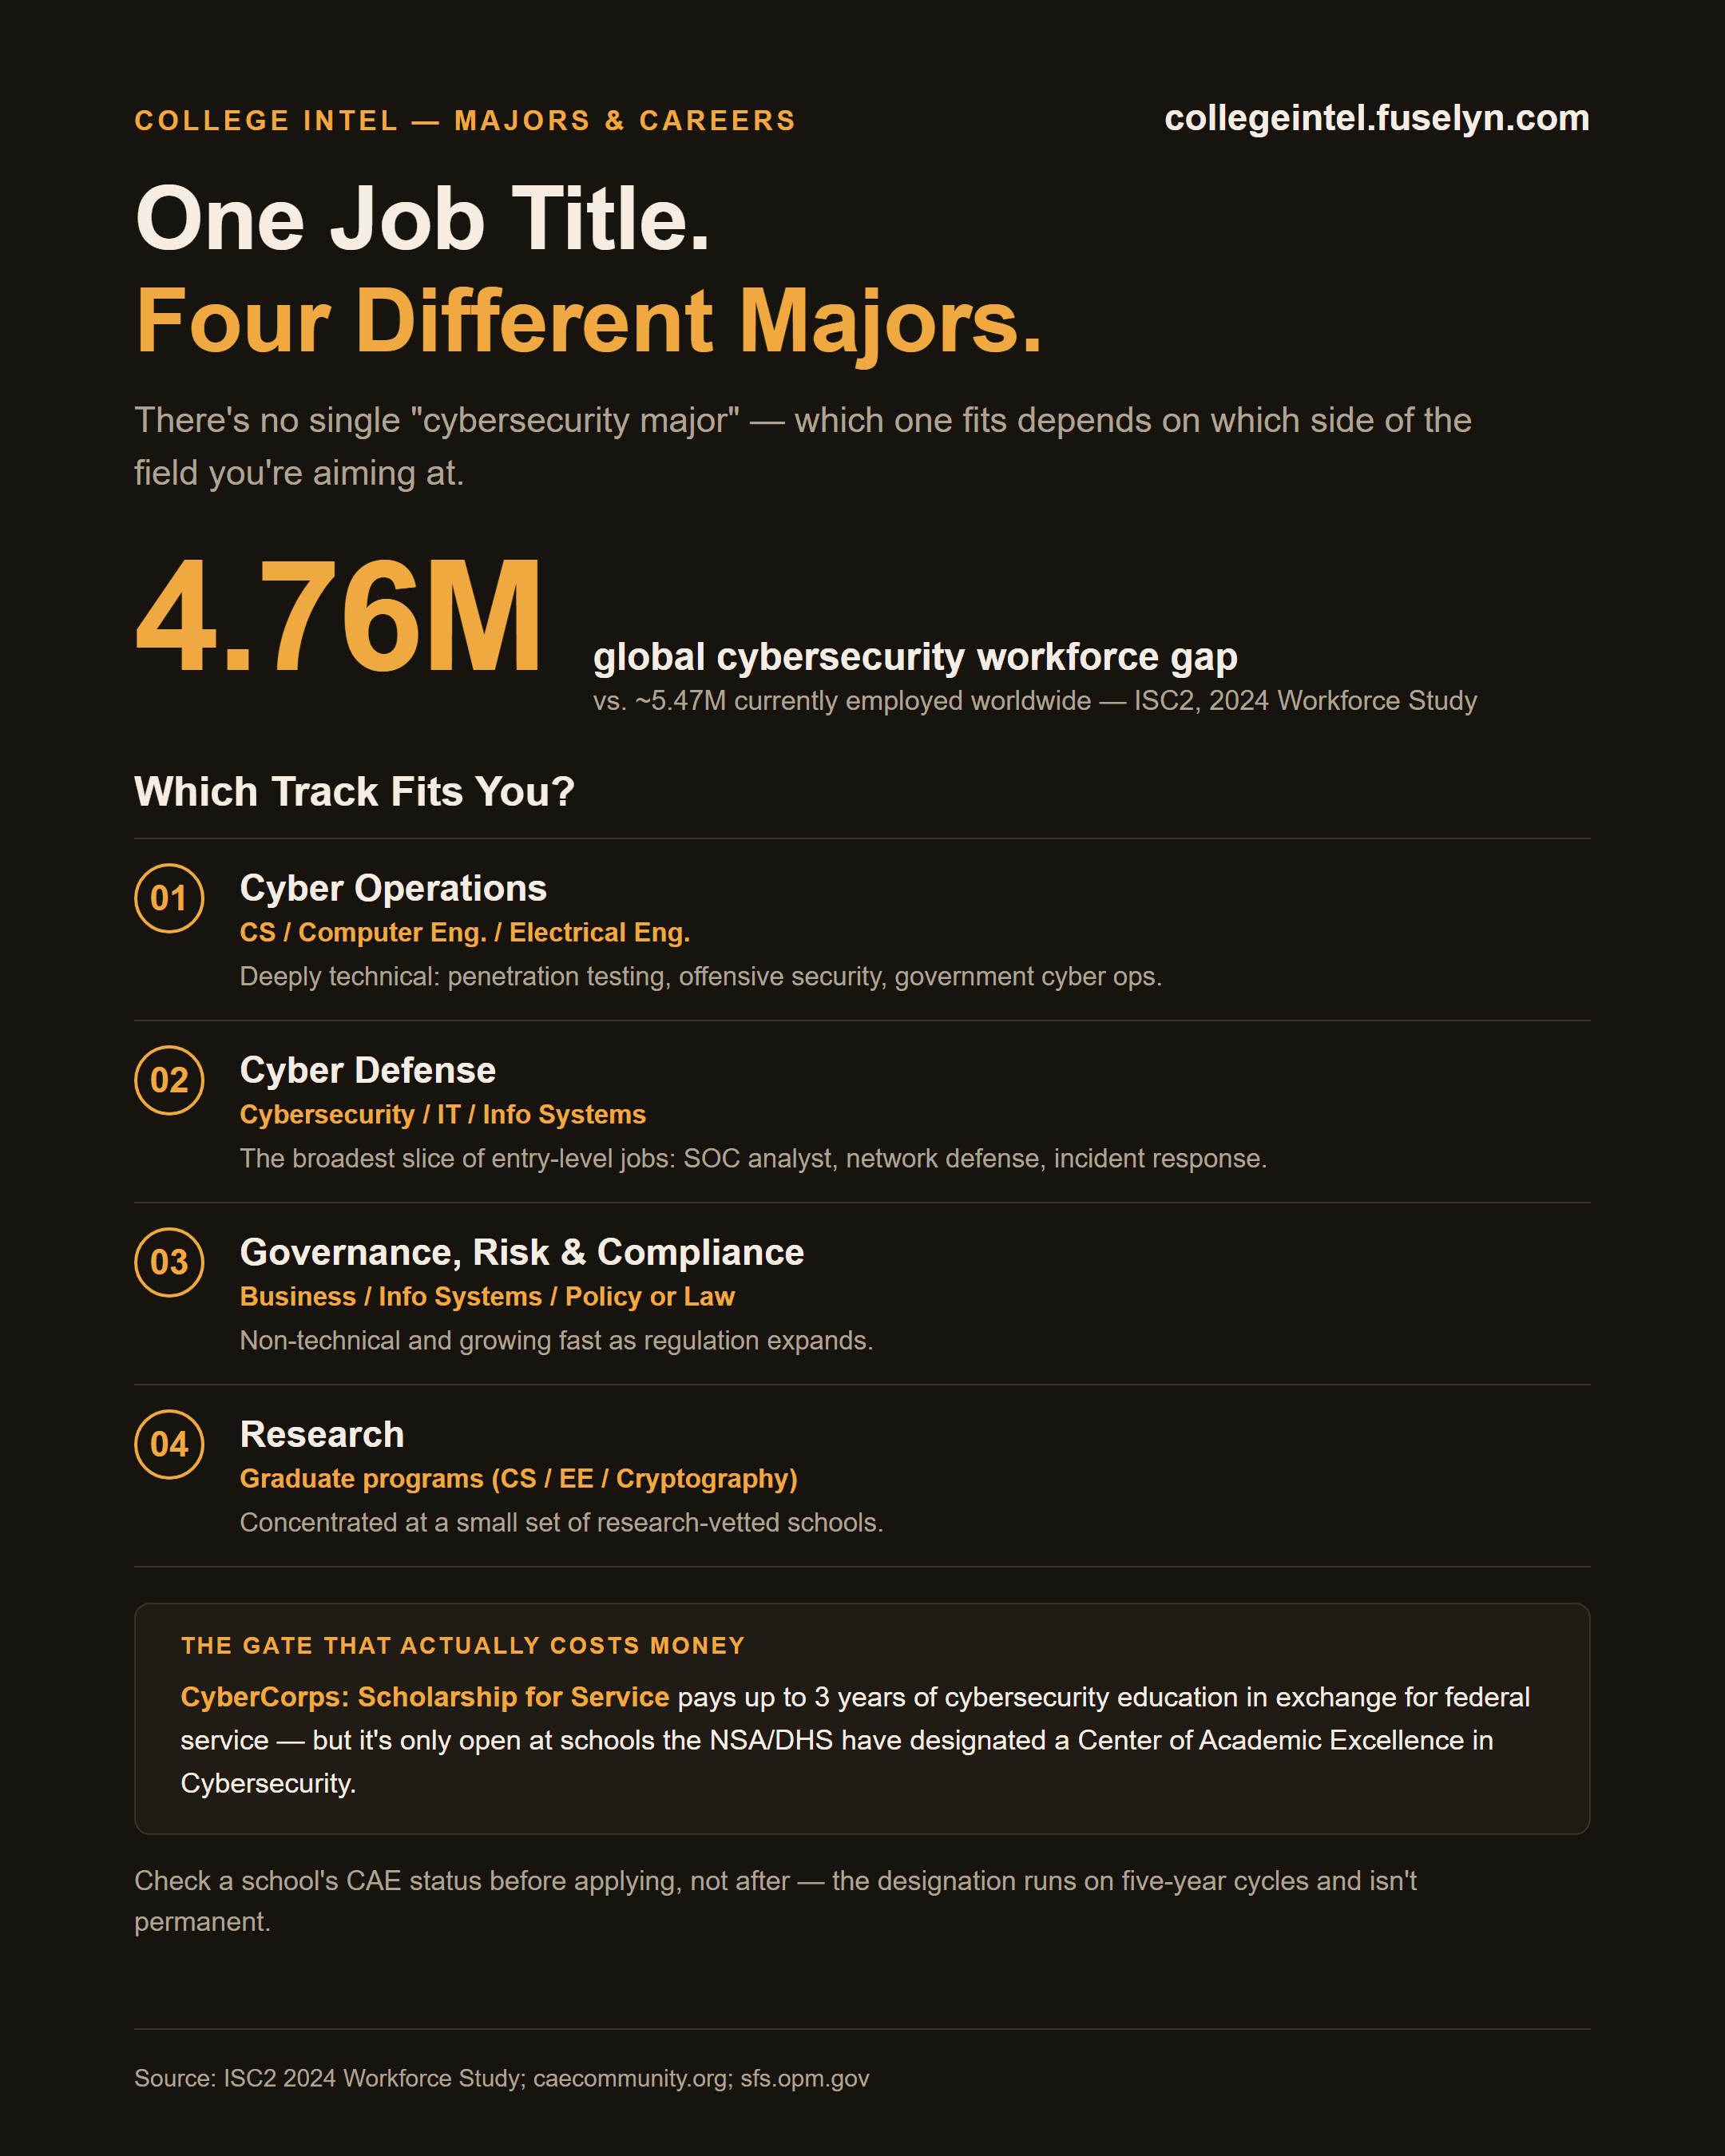
Infographic titled 'One Job Title. Four Different Majors.' 4.76M -- the global cybersecurity workforce gap, against roughly 5.47M currently employed worldwide, per ISC2's 2024 Workforce Study. Which track fits you: 01 Cyber Operations (CS / Computer Eng. / Electrical Eng.) -- deeply technical, penetration testing, offensive security, government cyber ops; 02 Cyber Defense (Cybersecurity / IT / Info Systems) -- the broadest slice of entry-level jobs, SOC analyst, network defense, incident response; 03 Governance, Risk & Compliance (Business / Info Systems / Policy or Law) -- non-technical and growing fast as regulation expands; 04 Research (Graduate programs, CS / EE / Cryptography) -- concentrated at a small set of research-vetted schools. Callout, 'The gate that actually costs money': CyberCorps Scholarship for Service pays up to 3 years of cybersecurity education in exchange for federal service, but it's only open at schools the NSA/DHS have designated a Center of Academic Excellence in Cybersecurity -- check a school's CAE status before applying, not after, since the designation runs on five-year cycles and isn't permanent.
Download printable PDFDownload for social (square)

Sources: ISC2 2024 Workforce Study; CAE Community (caecommunity.org); CyberCorps: Scholarship for Service (sfs.opm.gov).

Or check your own score against your state's line with the National Merit Selection Index calculator.